Thursday, March 4, 2021

EMRS: Liberals Still Have Hefty Lead, But Data Lacking On Clark Indie Runs

EMRS Feb 2021: Liberal 52 Labor 27 (+2) Greens 14 Others 7 

If these results were recorded in an election "held now" Liberals would win a majority (15-8-2, 14-8-3 or 14-9-2 most likely breakdowns.)

Poll was taken before announcement of Kristy Johnston independent candidacy for Clark

The first EMRS poll for 2021 has been released.  It confirms some degree of easing in the massive Liberal leads seen in the August poll last year, which may have been an outlier.  However it still has Peter Gutwein's Liberal Government on a primary vote above 50% and with a primary vote lead over Labor of 25 points, both of which imply another majority Liberal government if an election was "held now", and probably an increase in seat numbers.  That is, assuming the poll is reasonably accurate.

Tuesday, March 2, 2021

The Howard Aggregation 1993-1996

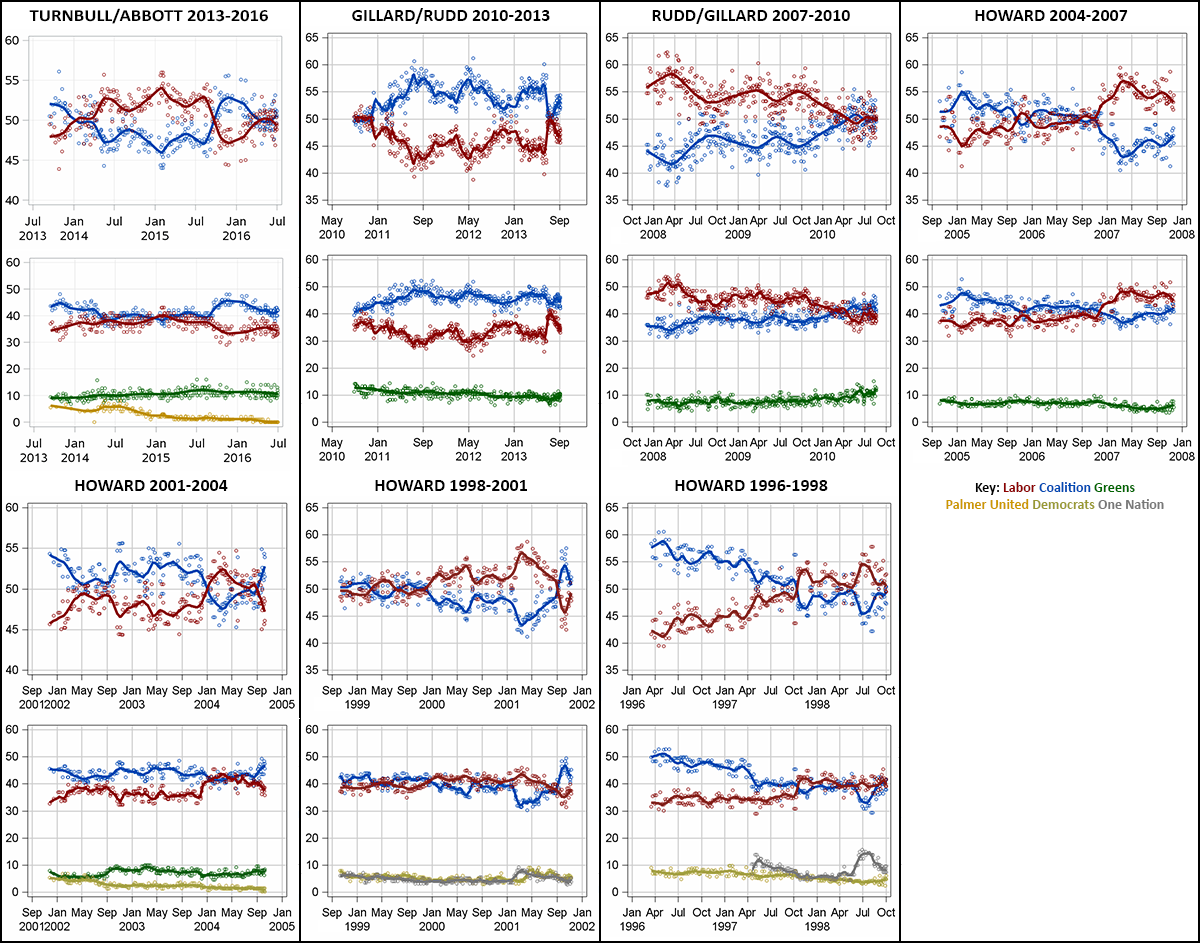
In 2018, on the 25th anniversary of the Paul Keating's famous and unusual 1993 election victory, I released The Keating Aggregation, an account of the well-known polling downs and lesser-known polling ups of the Hawke-Keating government on its way to that celebrated victory.  

Today, it is 25 years since the Keating Government was turfed by the Liberal-National Coalition led by a second-time Opposition Leader, John Howard.  And to mark the 25th anniversary of that occasion too, today I present a polling aggregation for the years 1993-1996.  Together with the above Keating piece, this means that 2PP aggregations for all the terms from 1990 onwards are now available online; other historic aggregations are available at Poll Bludger.  Incidentally, aggregation itself existed in the early 90s, and while looking for missing poll data I found old newspaper articles by Brian Costar that used 2PP aggregation to estimate election results.  What I haven't found yet from that time are any aggregation graphs.  

Wednesday, February 24, 2021

One More Nightmare: Group Tickets And The 2021 WA Upper House

Sorry to be so ranty about this, but I think that it has to be said.  The 2021 Western Australian Legislative Council "election" is a bad joke.  Voting systems should give voters real choices about how they vote and should only reward parties with serious voter support.  WA politicians have failed and disrespected the voters by doing nothing at all to deliver this.  Instead voters are still coerced, eight years after the 2013 Senate farce, into propping up another dishonest Group Ticket grift party fest.  If you can do it without making a mistake, vote below the line.

As noted four years ago (sigh) Western Australia's upper house has the worst voting system in the country.  The chamber is grossly malapportioned, with votes in two bush regions being worth nearly four times more than votes in Perth suburbs.  

Voters can vote by putting a one above the line, in which case their vote may be sent goodness knows where as a result of backroom preference deals and deliberate preference harvesting.  They cannot give preferences between parties as they can in the Senate.  The only other way in which it is permitted to vote formally is to vote below the line.  If you do this you must number every box (about 54 on average) and if you leave any box blank or skip or repeat any number in the sequence, your vote is informal. 

Saturday, February 20, 2021

WA 2021: How Lopsided Do You Want It?

The 2021 Western Australian lower house state election looks like the most lopsided state election for several years, and may be among the most lopsided ever.  A Premier with near-universal approval who won a large majority last time around takes on an opposition onto its third leader of the term amid a pandemic that has seen large polling boosts in most places that have not completely stuffed it up.  The comparison with the New Zealand landslide is impossible to avoid.  

Even with no COVID-19 and no Opposition disarray it would be a massive upset for the McGowan government to lose.  Two major patterns in predicting state results are "federal drag" (it is an advantage not to be the party in power in Canberra) and the age of the state government.  The last loss by a first term government that was in opposition federally in any state was back in 1930 and the historically expected result for WA Labor would be to gain about three seats.  That should be treated with some caution given that they have so many already, but to actually get near losing would be a massive outlier.

But there's been speculation that this might not be just a routinely heavy pasting of a hapless opposition (such as the crushings delivered by Labor Premiers Beattie, Bracks and Bacon at the end of their first terms in 2001-2) but rather something more spectacular.  Is the opposition heading for Tarago territory or worse?  The results of the opening Newspoll would suggest yes, while a uComms poll merely predicts an enormous but more manageable thrashing.  

Sunday, February 7, 2021

How Much Does A Home State Federal Leader Matter In That State?

This piece came about, indirectly, because the Courier-Mail was printing silly sentences again.  A piece commenced with the following lines:

"Kevin Rudd has refused to reveal whether under-pressure Opposition Leader Anthony Albanese can win Queensland despite the former Prime Minister joining him for day one of a whirlwind ‘jobs tour’ across the state. 

[..] 

Mr Albanese was joined by Mr Rudd on the pre-campaign hustings at Southbank – however the former Prime Minister declined to comment when asked by The Sunday-Mail about how or whether Labor could win the state."

Rudd claims he declined to comment because it was the Courier-Mail rather than because of the question.  Whatever the facts in that regard, two things stood out to me in the opening line. Firstly there's the idea that the former Prime Minister is a divine revelator who can exclusively "reveal" facts  about the prospects of Opposition Leaders in his state.  Secondly, the idea that winning Queensland is a realistic or relevant goal for an Albanese-led ALP.  After all, Labor currently needs an enormous 8.44% swing to win the 2PP in Queensland, and has only won the Queensland 2PP three times since the Second World War - 1961, 1990 and 2007, all of them by a whisker

Monday, February 1, 2021

Newspoll: Surprise 2PP Tie Takes Heat Off Albanese

The first Newspoll of this year had the potential to be a very significant one for Opposition Leader Anthony Albanese, but he has escaped it without major harm.  This was one of the more significant Newspolls lately because of the leadup, so I thought I'd briefly write about it and related themes.

Leadership speculation has been swirling around Albanese in recent weeks.  This started after forces within the CFMEU and closely linked to unionist John Setka spruiked polling claiming to show dire numbers for Labor in its Newcastle area seats of Shortland (4.5%) and Paterson (5.0%).  Setka was expelled from the ALP in 2019 at Albanese's insistence.  

The polling has not been published for scrutiny.  The polls were conducted by Chorus Consulting with Community Engagement.  No public polling for any election by Chorus is known to me, but their director is also a director of Redbridge, who have released other polls predicting similar doom for Labor in other seats including Dobell and Macquarie.  I have been told that Community Engagement did tracking polls for Labor at Victorian state elections, but as no results were published or given to me at the time there is no way to comment on their accuracy.  I am however aware of some polls by them that were published for the 2016 election and these were not that accurate overall (the worst a Higgins seat poll that had Liberal 42 Greens 25 Labor 20; the result was 52-25-15).

Friday, January 22, 2021

The Federal Government's Majority Is Three Seats, Not One

(23 FEB 2021: Scroll down for Craig Kelly update; the headline is now out of date!)

-------------------------------------------------------------------------------------------------------------------------

I have a number of pieces half-written, in the pipeline, or mostly written but not quite right yet, and hopefully most of them will see the light of day sooner or later, though I am extremely busy with contract work and other things through to about mid-February.  However having seen quite a few people making false claims about the size of the federal government's majority on social media lately, I thought I would just correct them and also make the case for using one convention of defining a majority instead of some of the others some people are using. 

The best way to define a government's majority, conventional in the UK especially, is the number of government seats minus the number of non-government seats.  In this case, 77-74=3.  In Australia it is fairly common to see alternative methods used involving the number of MPs who have to vote with the other side for a bill to be defeated.  However, these methods are inferior, because the mathematical consequences of every possible majority in the conventional form are different, but for the votes-to-swing methods this isn't always true. As a result, the votes-to-swing methods lose useful information and create confusion.   

Thursday, December 31, 2020

2020 Site Review

 This post presents site data for 2020.  The activity graph tells the story of the year (the units are unique pageviews per week):


Nothing much happened in the first half of the year except for a bad Newspoll for the government in mid-January.  However there were significant spikes of interest for the Eden-Monaro by-election, the Tasmanian Legislative Council elections, the NT election, the ACT election and the Queensland election.  The ACT election is the largest of the spikes above.

With it being neither a federal election year nor a Tasmanian state election year, traffic was well down on 2018 and 2019 (down 47% on 2019) and only exceeded the traffic for one other year so far, 2015 (this site started in 2012).  I also felt early in the year that COVID was swamping all other news consumption, leading to low interest levels in anything else.  

In 2020 I released 59 articles including this one.  This is the smallest number for a completed year so far (the previous lowest was 77) and a major cause of that has been the decline in both federal and state polling.  The most common subjects were federal polling (8 articles), the Queensland election (7), and the NT, ACT and Tasmanian Legislative Council elections (4 each).

Tuesday, December 29, 2020

2020 Federal Polling Year In Review

 At this time I normally release a review of the year in federal polling that, among other things, states the number of federal polls released that year.  See the 2019 review here. Things have got so weird in Essentialville and Morganland that for 2020 I can only report on how many have been released so far (since others with 2020 data are likely to belatedly appear next year), and in both cases, "released" becomes a stretch in the case of 2PP readings that have no public existence beyond a dot point on a badly labelled graph.  Such is life in the days after the 2019 polling failure.

How many polls?

This year saw 16 federal Newspolls released, the fewest since 1991.  Essential released 13 "2PP+" results (see my comments on this method here) as figures, and a further sixteen as dots on a graph. Morgan provided this mess:

* five polls for which it issued polling reports

* two further polls on its voting intention table

* at least one further poll result where the poll was not published but the 2PP can be inferred based on the stated poll to poll changes

* fourteen graph dot points (giving the impression of being weekly breakdowns from fortnightly polls) that include:

- eight readings that align exactly in time with four polls for which fortnightly 2PPs were public

- two consecutive readings that are out of whack with one of the public 2PPs by a week

- four readings that don't align with any of the otherwise public polls. 

Thus the total number of Morgan 2PP readings of which some kind of evidence was available publicly is at least 22 (to date) but this includes at least four double-counts.  

Applying a minimum standard that a pollster must publish a 2PP (and not just by reference to changes from a previous poll) to be included, there were 16 Newspolls, 13 Essentials and seven Morgans, for a total of 36 polls.  If this figure is used it continues the downward trend in the number of published polls per year.  However the number of 2PP readings compiled by the pollsters but not published other than as dot points is considerably higher; there might be as many as 63 independent readings, with others still to be (maybe) retro-released.

The mess created by Morgan in particular does no favours for the image of polling and I hope the new Australian Polling Council will recommend to its members standards that will avoid and discourage ad hoc decisions about when to retro-release polling data.  If a pollster wants to release voting intention polls in batches, as Essential are doing, that is one thing, but the pollster should then at least be transparent about when they will poll and ensure that all the readings are retro-released, not just some.