It's an almost annual tradition on this site to release something every Christmas Day. Click the Xmas tag for previous random examples. Why do I do this? Partly it's a present for those who like Christmas, which in a very low-key non-religious fashion includes your host, but it's also a present for those who don't want to deal with this particular Christmas or even generally cannot stand Christmas and just wish it was a normal day when normal things happened. And what could be more normal than niche meta-psephology? Therefore, the campaign against compulsory Christmasing brings you ... whatever this is.
Over the past few years I've been running opt-in Twitter "polls" for the amusement of my followers there, similar to the Not-A-Polls in this site's sidebar.
This started with the October 2020 Budget, because Budgets attract speculation about Budget bounces in party polling, but these bounces only rarely actually occur.

The "poll" got this one wrong. The Morrison government's 2PP rose by one point from 51 to 52.
Over the next several months I kept posting these intermittently, then from June 2021 I came up with a stable format. In general the "polls" would ask about the 2PP, the Prime Minister's netsat, the Opposition Leader's netsat and the PM's Better Prime Minister lead.
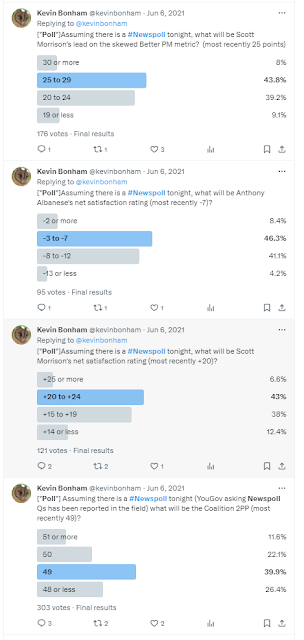
(Click for larger clearer version). The format I generally use is that for the 2PP if the government is behind the options are up 2 or more, up 1, no change, down. If the government is level or ahead the options are up, no change, down 1, down 2 or more. For the leader ratings the options are up 5 or more, unchanged to up 4, down 1 to down 5, down 6 or more. This is all to deal as best I can with one of the limitations of Twitter "polls" - that they only allow for four options (five would be so much better).
Sometimes I ask extra questions, eg about Budget ratings or the Voice or who will have the better netsat rating. These are not included in this review.
Of course Twitter "polls" are not polls at all. They're not even limited to my followers but at the mercy of at times being retweeted by high follower left accounts into their follower bases. I've frequently added disclaimers to this effect and promises to eventually write something up.

And here the interim results are! (I intend to do a further writeup in a few years time.) Do these Twitter "polls" have any value at all in predicting what will happen in Newspoll?
Polls included
My sample includes partial results for the Newspolls released on or about 6 Oct 2020, 30 Jan 2021, 21 Feb 2021, 25 April 2021 and 16 May 2021. From 6 June 2021 it includes full results and includes every poll up to the start of the 2022 campaign except 13 Feb 22. For the campaign it includes just 8 May and 20 May, then after the election 30 Oct 22 and the following in 2023: 5 Feb, 5 Mar, 14 May, 25 June, 16 July, 24 Sep, 26 Nov, 17 Dec. Whether I run it or not has depended on (i) time available (ii) whether I succeed in predicting when a Newspoll will be out!
For each poll I've counted the results as falling in four bins 1-4 where 1 is the best available option for the party and 4 is the worst, and I've also checked which bin the actual result landed in. As a main indicator I've then compared this with the average prediction. So for instance if 10% predict bin 1, 20% bin 2, 50% bin 3 and 20% bin 4, then the average prediction score is .1*1+.2*2+.5*3+.2*4=2.8. For a leadership score that range would mean 70% expected the leader's rating to worsen, and only 30% expected it to either stay the same or improve.
How did the "polls" go?
Overall my sample includes 103 predictive attempts from 24 "polls" where all four questions were canvassed and five early "polls" where some questions were canvassed but not others.
The plurality pick was correct in 38/103 cases (36.9%). That's a lot better than guessing, but it also isn't that impressive by itself. After all anyone vaguely familiar with Newspoll history will know that changes of 2% or more in the 2PP are pretty rare these days (yes it's happened three times in a row as I write, but that's the first time since the old bouncy Newspoll days back in 2015). Overall 35 of the 103 outcomes landed in bins 1 or 4 so simply tossing a coin between bins 2 and 3 (one of which always contains the no-change result) would on average have scored 34 correct picks. On the other hand, the random noise element in polls means we shouldn't expect miracles here; if the plurality managed to get, say, 60% right, that would be pretty amazing.
There wasn't any obvious difference in the optimism or pessimism of the predictions by party, which is surprising. The table below shows the average prediction for each group compared with the average result:

A plus score in the Difference column means that side tended to do worse than expected, a negative score means better. On both the 2PP and Opposition Leader netsat the average predictions and outcomes were very similar. On both Prime Minister netsat and to a lesser degree Better PM lead, the party in power tended to underperform compared to the Twitter predicition - in both the case of the Coalition under Morrison and that of Labor under Albanese. The predictions at this stage therefore don't have any partisan house effect.
The leadership "polls" underestimated the edge results (Bin 1 and Bin 4). Across these as a whole, the average vote for Bins 1 and 4 combined was 18%, but results landed in these bins 24/75=32% of the time. The biggest failure was the 25 June 2023 Newspoll:


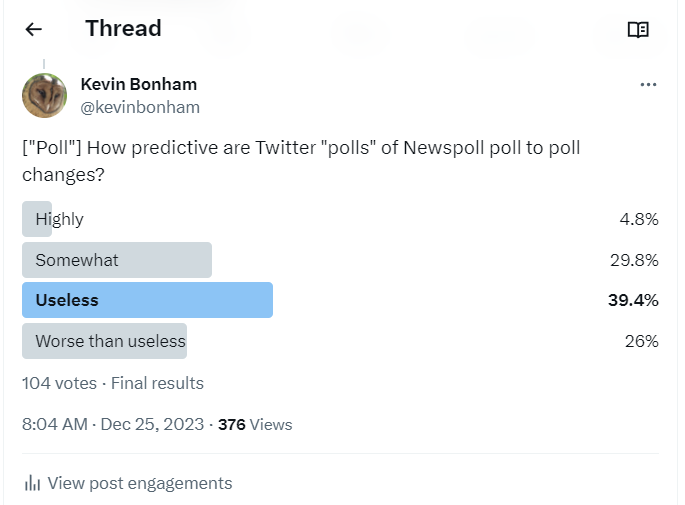
The plurality selected "useless" but in this sample at least the correct answer was "somewhat".
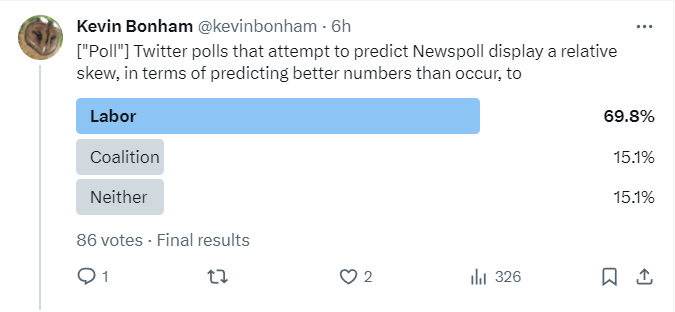
I would have guessed Labor in advance of doing the article but in this sample the correct answer was "neither". This may reflect my follower base; polls by a random Twitter occupant probably would skew to Labor.
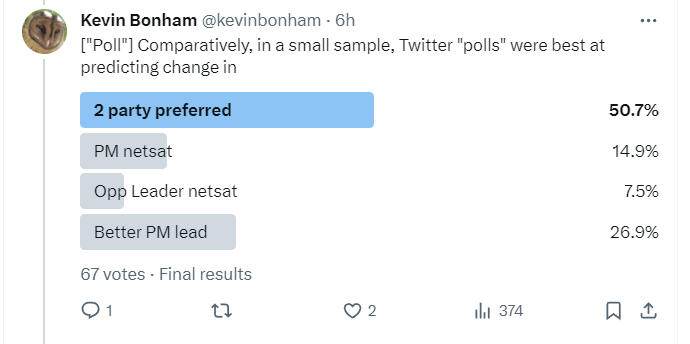
The majority got this one correct: 2PP was the best predicted indicator in this sample.

The 2PP option polarised respondents: those who didn't think it would be the best predicted tended to think it would be the worst predicted. However almost no-one (7 voters) correctly picked Better PM lead as the worst predicted, though I thought that was the obvious choice because of its compound nature.

For this one at one stage in voting, the correct answer (less often) was catching up, but then "more often" pulled away.
No comments:
Post a Comment
The comment system is unreliable. If you cannot submit comments you can email me a comment (via email link in profile) - email must be entitled: Comment for publication, followed by the name of the article you wish to comment on. Comments are accepted in full or not at all. Comments will be published under the name the email is sent from unless an alias is clearly requested and stated. If you submit a comment which is not accepted within a few days you can also email me and I will check if it has been received.