Fortunately 2022 has not been a repeat. The fallout from 2019 saw a great increase in polling transparency, especially via the formation of the Australian Polling Council (though unfortunately not all pollsters have been on board with that) and also more diversity in polling approaches. No one poll has ended up nailing the remarkable results of this year's election, but collectively, federal polling has bounced back and done well. This is especially so on two-party-preferred results, where a simple average of the 2PP figures released in the final polls is pretty much a bullseye. The primary vote results were a little less impressive.
Here I discuss polling in several categories. Overall YouGov (which does Newspoll) made the most useful contributions to forecasting the result, Redbridge's performance in publicly known niche polling during the campaign was very good, and Resolve Strategic's final poll was a useful counterpoint to Newspoll. The other major polls were so-so on the whole, and many minor pollsters were wildly inaccurate.
Final Polls
Pollsters are judged a lot by final polls, but final polls are only a single poll (so there's a degree of luck involved as to whether it's a good one), and final polls are taken at the time when there is the most data around for any pollster who might be tempted to herd their results in some way to base such herding on. However, the final poll stage is the only stage where, at least in theory, there's an objective reality to measure the poll against. A poll taken a few days out from election day should have a good handle on how people will vote, even more so now that so many people have already voted by that point. Any attempt to determine the accuracy of polls taken well before election day requires much more debatable assumptions.
It's also important to note that often which poll comes out as the most successful depends on how you choose to measure it. A few comments going into the following table:
1. In previous years I have used root mean square error (RMSQ) as my measure of the accuracy of final polls. However, I have found that absolute error is almost universally used in other sources' assessments, possibly because the maths is easier. The difference is that RMSQ punishes a small number of larger errors more than a larger number of small errors. In an absolute error estimate, being out on four parties' votes by 1% each is the same as getting two dead right and getting two wrong by 2%, but RMSQ says that the former is better. For this year's tables I give both figures; I think there are arguments for either.
2. 2PP remains the main way in which Australian elections can be and should be best predicted overall (for now), and while 2PP is partly a modelling exercise as well as a polling exercise, it is a service that most pollsters provide and that those that do not provide should (as it is important for interpretation). I consider 2PP estimates to be a very important part of Australian polling accuracy, so as well as giving one set of figures for primary vote error, I also give (and prefer) another in which primary vote error and 2PP error are weighted equally.
3. At this election Essential did not publish net figures with undecided voters removed. This means that rather than providing an estimate of how voters would vote at the time the poll was taken, the poll was providing an estimate of how 93% of voters would vote while providing no estimate for the remaining 7%. To compare the accuracy of this poll with other polls it's necessary to convert it by redistributing the undecided, which I've done in the standard way.
4. I've included the YouGov MRP figures in the table for comparison, although it was not a final poll, but a difficulty here is that it published seat by seat projections but not totals. The primary figures given were not published and were obtained after the election but are virtually identical (three differences of 0.1%) to figures calculated by Ethan of Armarium Interreta from the published primaries before the election. Had YouGov published totals it may well have rounded them to whole numbers. In any case as it didn't publish any totals I have avoided directly including it in the main list of final polls; likewise for Resolve I have included only the rounded totals that were published and not totals to one decimal place that were published post-election.
5. I've also included some irregular polling attempts by ANUpoll, KORE and the Australia Institute Dynata "exit poll", showing how badly these compared with the regular pollsters. 2PPs were not published for any of these but all would have seen massive 2PP wins for Labor, which didn't occur. Normally I don't include exit polls unless they are released within an hour or so of polls closing, but in this case I've made an exception, as what on earth is the use of drawing conclusions about how people voted (as The Australia Institute did) from an exit poll sample that was obviously garbage. (There was also an ANUpoll post-exit poll that was even less representative than the ANUpoll in the table, which didn't stop all manner of conclusions being drawn from it). I wouldn't have included KORE at all given the age of the poll except that they said that "the vote is largely settled".
6. Some pollsters published multiple 2PP estimates for their final poll. For Resolve I have used their respondent preferences estimate (51) not their last-election estimate (52) as the FAQ published by the client made it very clear that the former was to be regarded as the primary method and there was no indication otherwise. Ipsos published two different last-election estimates (53 and 54) and a respondent estimate (49-40 = 55-45) while making it clear 53 was to be preferred. For Morgan, they clearly switched to using a last-election estimate (53) rather than a respondent preferences estimate (56.5) just prior to the election. This appeared to be a case of method-herding to avoid a big error as their stated rationale for doing so ("We believe that as the election draws closer and early voting has now begun – starting yesterday – it is more accurate to estimate a two-party preferred result based on the voting pattern of the most recent Federal Election in 2019.") made the opposite of any sense at all. Surely if respondent preferencing was ever going to work and last-election preferences fail, that would happen closer to the election not further out from it.
7. Some assessments of polling error single out errors that were outside the pollster's claimed margin of error. This, comparatively, rewards polls with large claimed margins of error (eg those with smaller sample sizes or heavier weighting), but I think what is most important is how accurate a poll was, not how accurate it was compared to how accurate a (often primitive) margin of error model claimed it to be. Therefore I haven't done this.
Here's the table, sorted by a 50-50 weighting of average absolute primary vote error and absolute 2PP error (AVE2). Figures within 1% are shown in blue, figures 3% out or more are shown in red, and readings that were closest to the mark for the five final polls are shown in bold. The "pref" figure is the implied share of preferences going to Labor after accounting for contests with two Coalition candidates. The four error figures are shown at the right (in all cases the lower the score the better). As noted above I consider the AVE2 and RMSQ2 figures the best indicators since they include the 2PP. Ind/Others figures shown in italics are for polls that included ON and/or UAP under this heading.

The case for Newspoll is that it was closer on published 2PP (noting that Resolve also published a last-election estimate of 52), and only very slightly less accurate on absolute error on primary vote. The case for Resolve is that its primary vote estimates were slightly more accurate overall and in particular it avoided Newspoll's significant 3.4% error on the ALP primary vote (which is picked up by the RMSQ columns). Resolve also got the gap between the major party primaries right (an indicator far more relevant to overseas elections under first past the post, but with some predictive value in Australia since major party primary shifts are the main cause of 2PP changes). Both these polls clearly outperformed the other final polls, but neither was as accurate as the best polls in 2013 or 2016, when each would have been about midfield on the table. However, this was a more complicated election to poll, and polling has got harder since 2013 at least.
Resolve's post-election-published primaries to one decimal place would have made it clearly the most accurate of the final polls if published before election day. That said, perhaps if Newspoll's primaries to one decimal place were also published, this wouldn't still be true.
Morgan would have been a contender had it not had a stubbornly low UAP vote of 1% and continually overestimated the vote for Independents. I believe the latter came from having Independent on the readout everywhere. When Resolve started offering voters only the options available in their division, its previous problem with overestimating the IND vote went away.
Essential's result was not great. Because of the way Essential handled the undecided vote, one might say that the undecided voters all voted for Greens and teals so the poll was closer than it looked, but it still had the Labor primary vote too high even if no undecided voters voted Labor. (Plus undecided voters don't usually vote Green all that much). Essential had systematic issues with underestimating the vote for Independents and Others.
All the final polls were outperformed by the YouGov MRP on both indicators that include the 2PP. This applies irrespective of what set of figures are used for the MRP, including those rounded to whole numbers.
Overall, the five final polls collectively more or less nailed the 2PP as a result of two moderate errors cancelling out: they overestimated the primaries for either Labor (everyone except Resolve) or the Greens (Resolve) but they also - irrespective of the method used for the headline 2PP - underestimated the 2PP preference flow to Labor.
A notable feature of the 2022 polling was the age of the final polls. Based on field dates the final poll data had an average age of 6.4 days as of election day, compared to 3.2 days in 2016 and 4.8 days in 2019. The trajectory of polling as election day approached is consistent with there having been some late swing against Labor. The pattern of the swing to Labor being higher in votes cast before the day is also consistent with late swing, but it can also be explained at least partly by more voters using postal voting and hence the postal voter pool becoming less conservative. Late swing might therefore be a genuine factor in these not-so-final final polls overestimating Labor's primary, but I doubt it's the full story, and it needs more investigation.
Winners: YouGov/Newspoll and Resolve
2PP Tracking
As noted, final polls are not everything. It is also useful to try to get a handle on whether polls accurately portrayed the state of voting intention in the leadup to the election or whether a poll that had either skewed to one side or bounced around like a frog in a sock got lucky, or did something different, with its final reading. And in this case, some polls did do something different: Morgan switched its 2PP method, Resolve started publishing 2PPs and Resolve also beefed up its final poll with a phone component (having published in advance it would do so). Also, some polls altered their methods as candidate lists became available. Who most likely had an accurate handle on what was going on in the several weeks leading up to the election?
This is a challenging question to answer because it is very hard to answer it without subjecting a poll to some sort of judgement by a jury of its peers and/or itself. If one poll consistently told a story that other polls did not agree with, and that story ended up being the result, then was that poll right all along with the others herding to it at the end, or was that poll wrong? Also, a poll moving around is a good thing if (as in 2013) voting intention is clearly moving around during the campaign.
I suspect you'll find more sophisticated analysis of the tracking question elsewhere (looking at where the dots come out on Mark The Ballot's aggregation graphs is often interesting.) For my own attempt, I looked at released 2PPs in polls since the start of March and took as a starting point that the average of the final week 2PPs more or less nailed it. I found provisional house effects for the individual pollsters in the leadup based on the assumption that on average the polls had been right when taken, but split Morgan's 2PP polls into those that used respondent preferences as a headline and those that used last-election preferences. I then "corrected" each individual poll for these apparent house effects. I found that the scarcity of polls in March meant that the first usable week of data for tracking comparisons was that through to 2 April.
For each poll I compared the released 2PP (or derived for those polls with no released 2PP) to the average of the "corrected" polls by other pollsters released in that week. On this basis I estimated an average lean for each poll relative to what other polls found to be going on at the time (as adjusted for their house effects) and I also found the standard deviation (the lower the better) for the errors implied by this method.
The following were the results:
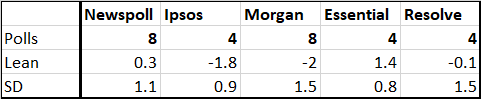
This is a rubbery method but its results are very consistent with my impression of the polls during the election leadup. Morgan and Ipsos produced at times implausibly strong readings for Labor and Morgan was also too volatile. Essential generally seemed asleep even when other polls suggested the Coalition was having an especially bad time of it (this is probably because of its use of party ID as a weighting). This leaves Newspoll and Resolve, neither of which had any skew to speak of but Newspoll was generally steady while Resolve tended to swing from disastrous to fairly benign results for the Coalition. Only one Newspoll in early April was flagged by this method as any sort of outlier, but this may well have been because the Morgan and Resolve polls in the same week were laying it on a bit thick for Labor (even in the former's case by Morgan's standards). When I expand the comparison to include the previous week's polls, Newspoll's SD drops further to 0.7 while Resolve's increases to 1.7. All up I consider that Newspoll had the best 2PP tracking.
I have not tried to analyse primary vote tracking but I think that various pollsters had persistent skews there, eg Newspoll overestimating Labor, Resolve overestimating first Independents then the Greens, Morgan overestimating independents, and Essential overestimating majors and underestimating independents/others. I should add that while Essential has scrubbed up fairly poorly from an accuracy perspective, by doing something different it did provide a cautionary note against landslide scenarios seen in many other polls. It is better to do something different even if it's not a very successful experiment than to herd.
Winner: YouGov/Newspoll
Individual Seat Polling
Seat polling has been under the pump in Australia for a long time. In 2013, seat polls skewed severely to the Coalition. In 2016 they skewed to the Coalition to a lesser degree and were also under-dispersed (less variable compared to the previous election than they should have been). In 2019 they skewed to Labor, though YouGov had a high strike rate in seats where it picked a winner. They were also poor at some high profile by-elections, such as Longman and Wentworth in 2018.
At this election there was not a great amount of seat polling seen, especially with YouGov largely switching to its MRP model instead, covered below (the MRP was a nationwide poll, but the results for specific seats are a poll-based model influenced by other seats, and shouldn't be treated as polls of that seat). What was seen was often commissioned polling, reported in insufficient detail. Multiple seat polls were seen during the campaign proper by three pollsters: Redbridge (mostly of teal seats for Climate 200), uComms, and Utting Research. There was also a series of 2PP results released via media for something calling itself the Industry Association, but it was never to my knowledge determined who the pollster was.
For many of the seat polls released there was no released 2PP or 2CP figure so I have had to estimate my own off the (sometimes incomplete) primary votes. In some cases the poll itself contained enough data for a respondent preferences estimate, in others I have used estimated preference flows.
In the following table I give the number and percentage of polls for which each pollster or source had the right party winning, and an "ease" figure to indicate whether the seats should have been easy to get right given the eventual margin. The "ease" figure is the theoretical average strike rate given a poll with an average error of 4%, but it ignores sources of error such as having the wrong party in the 2CP (which happened in one poll in the sample.) The skew figure is the average extent to which the poll skewed to the non-Coalition side (minus equals skew to Coalition) and the error figure is the average raw error. Where multiple results were recorded by the same pollster, only the last is included.

Once offs during the campaign include Compass Polling of North Sydney (wrong winner and way off except for nailing that TNL's Victor Kline would receive 0.8%), Community Engagement of North Sydney (an early poll and hard to tell who would have won based on it), an escaped YouGov of Pearce (right winner, well off on the margin), an early-campaign Laidlaw poll of Fowler (wrong winner but at least showing Dai Le had potential). There was also a brace of incomplete 2CPs given to Peter van Onselen that proved to be internal polls from long before they were taken; all four had the right winner but these overestimated the Coalition by 2.4% on average. And there were all the usual rumours about vague results from internal polling that I have not covered here.
Winner: Redbridge
Pollster Forecast Models
The totals for the YouGov MRP have been discussed above. The MRP (which predicted 80 seats to Labor, 63 to the Coalition and 8 for the crossbench) was especially interesting as an attempt to improve on the problems of seat polling by using small samples in each seat but then scaling each sample to the results of seats that were comparable, hence giving each seat a larger effective sample size in an attempt to smooth out the bumps.
In the seats won by major parties, the MRP was very successful, predicting 131 of 135 seats correctly (the only incorrect predictions being Lindsay, Bass, Tangney and Hasluck, two on each side). In seats which the MRP predicted to finish as two-party contests, the average 2PP skew was 0.3% to Coalition and the average raw error was 3.3%. There was, however, a significant 2PP skew in WA where the MRP underestimated the Labor charge by 4.7%.
It has, over time, been very difficult for any model to reliably do better than getting about 10 marginal seats wrong so (allowing for a few marginals becoming non-classics) to only get four wrong is an exceptional result. On the other hand the MRP did less well with non-classic seats, missing the three Green gains in Queensland (although projecting the LNP would lose Brisbane) and missing four of the six teal gains and Dai Le's win in Fowler. The latter was down to seat-specific factors hence not predictable by the MRP's methods. In the case of Brisbane it is not clear if the error lay with the poll or the interpretation of the numbers in terms of the Greens getting from third into second on minor party preferences.
Overall the MRP's projection of 80 seats to Labor also had benefits because although pretty much every poll suggested Labor was either on track to a majority or capable of winning a majority, commentators at this election were exceptionally prone to make stuff up about what the polling meant if true. To have a major pollster put out an actual forecast of the results, not just a set of numbers that mass media commentators would then misinterpret or simply ignore while churning out a preconceived narrative, had its uses.
The only other loosely poll-based projection forecast model by a pollster I'm aware of was by KORE, which did have a predictive success in that its "Effective Vote" table was very close to the actual seat tally, at 81-54-16 (Labor-Coalition-Other) compared to the result of 77-58-16. The major party seat results being anywhere near right here was, however, a result of two very large errors cancelling out. The actual "effective vote" (a tally of 2CP votes recorded by each party and others) was 45.6 for each major party and 9.2 for others, nothing like KORE's 54-35.7-10.3 to Labor which would have resulted in an enormous seatslide. But also the relationship between "effective vote" and seat share is nowhere near proportional - a small advantage could convert into a big seat margin. In this case Labor got a big seat margin with no effective vote advantage, largely because the Coalition racked up useless 2CP votes in 13 mostly close non-classic seats that it lost while Labor only made the 2CP while losing in three, two of them lopsided.
Winner: YouGov (essentially unopposed but the MRP was good)
Senate Polling
Senate polling has a history of being even worse than seat polling. There were not many attempts this year and those that there were were mostly showing their age by election day, so I consider everything from the start of March.
The Australia Institute issued Dynata polling for every State except Tasmania. The four-sample poll underestimated the Coalition in every State by an average of 3.5% and overestimated Labor in every state by 6.0%, equivalent to a nearly 5% 2PP error and hence wildly inaccurate. It was fairly accurate on the Greens vote (0.6% under), overestimated One Nation in every state except Queensland, but by less than in 2019 (1.2% over), overestimated UAP slightly (0.6% over), underestimated Liberal Democrats in every state (1.4% over), overestimated Nick Xenophon in SA (3% over) while getting Rex Patrick right, and underestimated parties not listed in every state and by an average of 3.6%. This wasn't an age of data thing as the final sample had even greater errors on Labor and unlisted parties.
Results were seen of two Redbridge polls for the ACT Senate. The last of these correctly predicted David Pocock's victory, getting the votes for the Liberals, Pocock and the Greens almost exactly right but having Labor 6.3 points too low, Kim Rubenstein 1.6 too high and UAP 3.8 too high (overestimating the UAP vote is a common feature of Redbridge polls). On these numbers Pocock would have won less comfortably as preferences that flowed to him strongly in the election would have split between him and Labor, but he still would have won. A Community Engagement poll from late March had Pocock much too low, as did Redbridge at the same time, but it's likely Pocock built up steam as the campaign went on, so these polls may have been accurate when taken.
A Lonergan Senate poll of SA, of unknown commissioning source and dates, was incompletely reported by the Advertiser on 18 May. The results as reported (with Labor on 34 and Liberals on 23, and it being unclear what was done with undecided) proved way off as it was the Liberals who ended up with 34 and Labor on 32.3. Finally a uComms of Braddon, Tasmania in March overestimated Labor by 8%, and underestimated the Liberals by 3.6% and parties not listed in the readout by about 5%.
Winner: It's a low, low bar for this one but Redbridge again
I intend in a separate article some time later to review the major polling story of this cycle, being the formation of the Australian Polling Council and the increased disclosure efforts by many pollsters, and to review how the attempt to improve transparency in polling panned out and where it can go from here.
No comments:
Post a Comment
The comment system is unreliable. If you cannot submit comments you can email me a comment (via email link in profile) - email must be entitled: Comment for publication, followed by the name of the article you wish to comment on. Comments are accepted in full or not at all. Comments will be published under the name the email is sent from unless an alias is clearly requested and stated. If you submit a comment which is not accepted within a few days you can also email me and I will check if it has been received.