Yesterday the 2022 House of Representatives figures were added to the archive of election results, making lots of the usual preference flow goodies available. Although all the preference throws had been completed and uploaded in rough form some time ago, the final figures importantly include the two-party preference flows by party and two-candidate preference flows by party per seat. As well as this piece I will also be putting out a full analysis of polling accuracy, I expect within the next few days.
Some of the ground that I normally cover in this article was already covered in Two Party Swing Decided This Election (Plus Pendulum). That article showed that Labor won the election on normal two-party swing in classic Labor vs Coalition seat contests, with changes in the seat share for the major parties pretty much exactly matching historic patterns, and that the groundbreaking defeats for the Coalition at the hands of six new teal independents and two Greens were nonetheless a sideshow in terms of explaining how the election was won.
The article also noted:
* that Labor would have won the election under any system (contrary to the nonsense of the "3 in 10 voters" Sky right disinfo crowd who are wrongly claiming the Coalition would have won under first past the post - a different system would have seen different voter behaviour)
* that the view that Labor's primary vote was greatly damaged by strategic voting for teal independents is incorrect
* that Labor's win was assisted by gaining higher swings in Coalition seats on any margin and in marginal Labor seats, while in very safe Labor seats the swing was weaker to zero
Preference Shifting and Card Impacts
The official 2PP is 52.13% to Labor and 47.87% to the Coalition, a 3.66% swing to Labor. (There was an unlikely 2PP flow in a booth in North Sydney which if changed would have made the 2PP 52.14, but no changes have been made there; I do not know if the 2PP flow was rechecked.)
The 2019 election saw an unusual if modest preference shift in the Coalition's favour - the largest to the Coalition since the 1950s - but Labor still received more preferences than the Coalition in that year. This election largely reversed the 2019 shift, with Labor's 2PP coming in 0.99 points higher than would have been expected based on the primary votes and the 2019 flows by party from Greens, UAP, One Nation, independent and others. 2022 therefore follows 1990, 2013 and 2019 as uncommon examples of such a preference shift in the last 40 years. It will be interesting to see if 2019 was an anomaly or if 2025 sees a shift back to the Coalition again.
The change in flow has happened across the board rather than a sharp shift from any one source:
* Greens 85.66% to Labor (+3.45% and a record high)
* One Nation 35.70% to Labor (+0.92)
* United Australia 38.14% to Labor (+3.28)
* Independent 63.77% to Labor (+4.37)
* all others 45.33% to Labor (+0.63)
The 2PP loss on three-cornered contests from the Coalition side was 0.03%.
So for polls that break out all of these, the formula for Labor's 2PP by 2022 election preferences will be:
2PP = Labor + .8566*Green +.3570*ON +.3814*UAP +.6377*IND +.4533*Others + 0.03
The following are flows to Labor for some combined categories pollsters may employ:
* Others including IND 54.73
* Others including UAP 42.11
* Others including IND and UAP 50.01
* Others including ON and UAP 39.86
* Others including IND, ON and UAP (all non-Greens) 46.37
* Green+IND+ON+UAP+Others (all non-majors) 61.54
After splitting to the Coalition over Labor in every classic seat the party contested in 2019, One Nation preferences did the same again, except in Gorton where Brendan O'Connor got a 53.71% share. The strongest split from One Nation to Coalition was 81.91% to Darren Chester (Gippsland). One Nation voters also preferred Rebekah Sharkie to the Coalition in Mayo, and preferred independents to the Coalition in Calare, Groom, Wentworth, Wannon and Indi.
I have records of five seats in which preferences were distributed between the major parties and One Nation recommended a preference to Labor on its how to vote card (Bass, Cook, Franklin, Lyons, Sturt). In these the average flow of One Nation preferences to Labor was 7.8% higher than average, suggesting that the cards had not much impact.
United Australia voters preferred Labor to the Coalition in ten classic seats (up from four) with Spence (59.65 to Labor) heading the list; the rest were Greenway, Forrest, Blaxland, Scullin, Canning, Macarthur, Swan, Ballarat and Jagajaga. The strongest UAP to Coalition flow was 81.52% again to that popular MP, Darren Chester in Gippsland. UAP voters also preferred Rebekha Sharkie in Mayo to the Coalition, and preferred independents to the Coalition in North Sydney, Cowper, Indi and Groom.
I have records of four seats outside WA that finished as 2PPs where UAP recommended a preference to Labor (Banks, Cook, Dickson, Maranoa). In these the average flow of UAP preferences to Labor was a mere 4.9% stronger than overall. For Western Australia I saw but did not confirm reports that the UAP pursued an anti-incumbent strategy on their cards. The preference flows suggest they indeed did this with a 65.0% flow to Coalition in Labor seats but a 53.7% flow to Coalition in Coalition seats (a modest difference of 11.3%). Again, the evidence is that minor party how to vote cards don't make a lot of difference.
The weakest 2PP flow involving the Greens was 71.95% to Labor in Parkes. There were weaker 2CP splits off the Greens in three non-classic seats - Kennedy 64.21 to Katter vs LNP, Clark (where the Greens issued an open card) 66.52 to Wilkie vs Labor and Fowler 64.47 to Labor vs Dai Le.
Flows from the Coalition to Labor over Greens in the Labor vs Greens 2CP seats ranged from 58.65 (Canberra) to 73.33 (Wills) with an average of 65.6%.
In the semi-optional-preferencing Senate, there were far greater shifts in the 2PP preferencing behaviour of UAP voters (shift from Coalition to exhaust) in particular, and overall Labor won the Senate 2PP 52.93-47.07, 0.8% higher than its win in the Reps despite optional preferencing systems having a reputation for not helping the trailing party. I will probably explore this in more detail but any idea that the Coalition would have done much better under optional preferential voting (which JSCEM recommended but the previous government didn't pursue) is delusional. It's possible they would have lost more heavily in seat terms as UAP voters especially would have exhausted their preferences rather than reluctantly preferencing the Coalition (a la Queensland 2015, where OPV saw a huge preferencing shift in Labor's favour against a disliked LNP government.)
Non-Classic Seats
There were 27 non-classic seats at this election (up from 15). These are seats where the final pairing wasn't Coalition vs Labor:
ALP vs Green (6): Grayndler, Cooper, Wills, Canberra*, Melbourne, Sydney*
Coalition vs Green (3): Brisbane*, Griffith*, Ryan*
Labor vs IND (2): Clark, Fowler*
Coalition vs IND (14): Indi, Warringah, Wentworth, Kooyong, North Sydney*, Mackellar*, Curtin*, Goldstein*, Calare*, Groom*, Nicholls*, Bradfield*, Cowper, Wannon*
Coalition vs Centre Alliance (1): Mayo
Coalition vs KAP (1): Kennedy
Those marked * were not non-classics last time. Three seats moved from non-classic to classic status (Maranoa, Farrer, New England). Melbourne and Kooyong both shifted from one non-classic status to another while Cowper had a different independent in the 2CP to 2019.
Labor 2PP winners failed to finish in the top two in Brisbane, Griffith, Ryan and Mayo. In the first three of these Labor were also probably the Condorcet winners (the candidate, if there is one, who would win head-to-head against any other candidate), based on the Coalition to Labor flows recorded elsewhere. I may discuss this in more detail sometime too.
As explained way back in 2013 I like to explore Labor-vs-Coalition 2PP splits for those voters who preferred the "non-classic" candidate to the majors, as this reveals what sort of voters a potential crossbencher might be beholden to. Sometimes this can be done exactly for the voters who put the non-classic candidate first, rather than just for those who put them above the majors. I understand from Antony Green that this year the AEC was in a position to extract exact splits for every seat, which would save me a lot of work, but I've not yet seen those published. Here's a table showing 2PP preference flows from the non-classic contender to Labor in the non-classic seats:
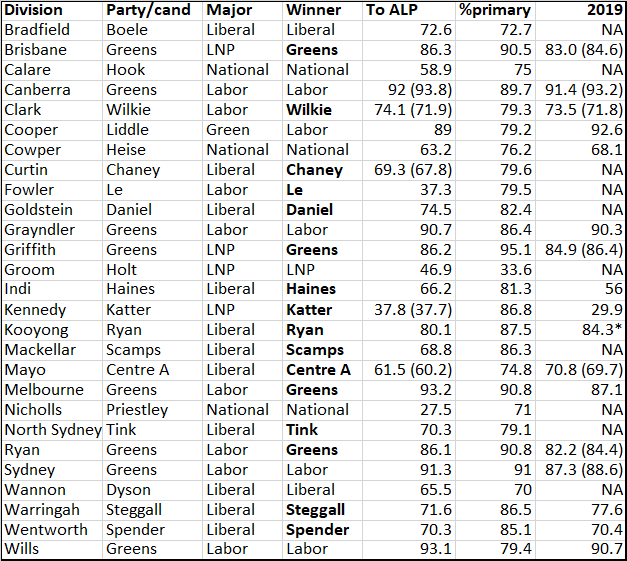
The "To ALP" column shows the percentage of the 3CP voters for the non-classic contender that put Labor ahead of the Coalition. In some cases the figure for the primary votes for the non-classic contender is also available, and this is shown in brackets. The %primary figure shows how much of the non-classic contender's 3CP vote is their primary vote (the higher this is, the more accurate the "To ALP" figure is likely to be as an estimate of the 2PP split of their primary votes.)
Overall this table shows that those who voted for independents, or preferenced them at 3CP level, generally strongly preferred Labor to the Coalition. The exceptions were Groom (where most of Suzie Holt's 3CP votes were primary votes for other candidates), Fowler (where Dai Le's campaign attracted mostly voters who preferred the Liberals in this instance, though possibly in disgust with Labor's preselection or by following a Dai Le how to vote card) and Nicholls. In most cases, teal independent voters or preferencers preferred Labor to the Coalition about 70-30, which isn't surprising. Rebekha Sharkie's voters were more Coalition-friendly than last time, but this probably reflects her taking more votes from a struggling Liberal candidate.
Strongest preference flows
The following are the strongest preference flows I could find evidence of, whether those preferences were distributed or not. Estimated flows shown in bold:
93.1 Sarah Jefford (Green) to Peter Khalil (Labor), Wills
92.9 Liz Chase (Green) to Kate Thwaites (Labor), Jagajaga
92.2 Vivian Harris (Green) to Kirsty McBain (Labor), Eden-Monaro
92.2 Tony Hickey (Green) to Susan Templeman (Labor), Macquarie
91.6 Cate Sinclair (Green) to Lisa Chesters (Labor), Bendigo
91.3 Chetan Sahai (Green) to Tanya Plibersek (Labor), Sydney
91.2 Charlotte McCabe (Green) to Sharon Claydon (Labor), Newcastle
90.8 Jade Darko (Green) to Julie Collins (Labor), Franklin
90.7 Rachael Jacobs (Green) to Anthony Albanese (Labor), Grayndler
90.6 Sam Wainwright (Socialist Alliance) to Josh Wilson (Labor), Fremantle
No comments:
Post a Comment
The comment system is unreliable. If you cannot submit comments you can email me a comment (via email link in profile) - email must be entitled: Comment for publication, followed by the name of the article you wish to comment on. Comments are accepted in full or not at all. Comments will be published under the name the email is sent from unless an alias is clearly requested and stated. If you submit a comment which is not accepted within a few days you can also email me and I will check if it has been received.