I am hoping to have a Senate prospects piece up by the end of tomorrow but before that I think I need to address something I am hearing too much of at this election. I refer to trendy talk about federal elections being seat-by-seat battles, the election being 151 separate contests, and the idea that even a massive 2PP win (should Labor be so lucky) might seriously not result in a Labor majority. We hear this stuff at every federal election but this time around the commentariat seems especially awash with it. This piece is pretty mathsy (let's say 3/5 on the Wonk Factor scale) but it's necessary to crunch a few numbers to show what a load of nonsense we are hearing.
The state of play
Firstly a brief word about polling since last week's roundup. Two polls have been released, a Newspoll with Labor 53-47 ahead (L-NP 36 ALP 37 Green 10 ON 4 UAP 3 others 10) and a Morgan with Labor 57-43 ahead by Morgan's respondent preferences (L-NP 32.5 ALP 36 Green 12.5 ON 5 UAP 1.5 IND 8.5 others 4) . However, if last-election preferences are used the Morgan only comes out at 55.4 to Labor, so Morgan's headline 2PP not changing can be ignored. (The expected value for the Newspoll off the published primaries is 52.8, but Newspoll would have a more accurate number based on rounding). By last-election preferences the average of the most recent polls from each major pollster is now 54.2 to Labor. There is a reasonably strong case based on the history of Australian polling generally that this is probably skewing to Labor a little bit and the real underlying voting intention is more likely somewhere in the 53s, but always beware of Nate's 1st Rule. In any case, history suggests that whatever lead Labor now has will probably (but not necessarily) reduce by the time of the final result.
The Newspoll was notable in that it saw the Coalition inside the historic "recovery window" discussed in the previous roundup for the first time after five polls in a row outside it. The Howard government won despite polling a 47% 2PP in the final poll of the campaign - but it did so with only 49% of the 2PP vote as a result of (i) personal vote effects from the previous election (ii) excellent marginal seat performance and also I believe (though I haven't checked in detail) (iii) its 2PP being deflated by One Nation's preferencing strategy. This year 49.0% 2PP might be enough to win, but probably not.
Being inside the recovery window doesn't mean the Coalition will win, as its latest Newspoll is still worse than those being recorded at the same time by the Rudd government which was thrashed in 2013, and worse than one recorded during the campaign by the similarly thrashed Keating government in 1996. But at least there is now some overlap with the Keating 1993 and Howard 1998 governments which won, even if it is only that the Coalition's best poll so far is no worse than those governments' worst polls within the campaign.
It is also worth mentioning Keating 1996 in the context of comments about Scott Morrison's Better Prime Minister lead increasing to a meagre five points, since Keating was rated Better Prime Minister by a similar amount in the last five polls in the 1996 campaign, yet his government was thrashed. On the other hand, we again this week saw the resilience of Scott Morrison's personal rating, with him recording a mediocre but not awful -12 net satisfaction despite all manner of preselection-related accusations against him. (I'd advise those on the left claiming that the PM is extremely unpopular to zip it less they appear out of touch with those who still approve of his performance and have many friends who think the same.)
The last thing I should mention is that Labor has lost 4% on primary vote in Newspoll in four weeks and this, together with an "are you serious?" level gaffe from Opposition Leader Albanese regarding the unemployment and cash rates, would probably be causing some jitters on the Labor side. For the time being Labor remains way ahead on 2PP estimates, but following polls will be of interest.
2PP Swing As A Predictor
Examples of the genre of comment this article addresses includes Morgan saying that "Anything less than a 5% point swing to the ALP at the election could well result in a hung Parliament", John Black saying "It's no longer the average swing as applied uniformly across the country that determines who wins" and David Crowe saying "This will be a seat-by-seat battle where everything will turn on a few electorates and candidates at a time when the pandemic has given priority to state authority and local identity, making it risky to assume a national trend. There is no such thing as a uniform swing."
There is indeed no such thing as a uniform swing, in the sense that every seat is different. But sometimes swings by seat are significantly different from uniform, and sometimes they are not. Any given seat will on average vary by a few percent from the national swing, but in most seats such variation won't result in a different winner. Where it does the gains and losses will rather often cancel out. Sometimes there might be a large swing in a small state that takes out extra seats in that state, but in that case the swing in the bigger states is slightly smaller for the same 2PP vote and so fewer seats may change in the big states.
Where uneven swing sometimes does matter is where it is uneven in terms of party and margin. We saw this unevenness at the 2019 election - the Coalition had average 2PP swings to it in its marginal and second-tier seats and swings away from it in safe seats, while in Labor seats there was an average small swing to the Coalition whatever the margin. This actually didn't affect the outcome (indeed the Coalition underperformed slightly in terms of how many seats it won for its 2PP vote), but with a smaller 2PP swing it would have helped the Coalition retain power. This sort of unevenness can be caused by personal vote effects from previous elections (if one side has a lot of new MPs in marginal seats), retirements (if one side has a lot of marginal seat vacancies) or simply better marginal seat campaigning. In 2019 while the issues mix helped the Coalition in marginal seats, it is also the case that Labor spread itself too thin by targeting too many seats.
Anyway, I thought I'd explore the history of 2PP swings since 1961 (cutoff chosen because of uncontested seats prior to 1958) and how they relate to parties winning seats by graphing the 2PP swing in comparison to the seat-share swing. Each major party's seat share is the number of seats it wins as a percentage of all major party seats. This makes it the 2PP equivalent for seat victories. However the seat share has a much wider range of values than the 2PP. In 1975 the Coalition won a 71.7% seat share and in 1983 Labor won 60%.

The first thing I think should be noticed here is that the 2PP swing and the seat share swing almost always go in the same direction. This has happened at 22 of the 23 elections, the exception being 1987. In 1987 both swings were very small. (I should note by the way that the youngest election not included above, 1958, appears to be another case of the swings going in different directions.)
The second thing that should be noticed here is the very tight fit between 2PP swing and seat share swing. Even though we should not necessarily expect a linear relationship, a simple linear regression finds that 90% of the variation in seat share swing is explained by 2PP swing. Also, the two elections that do the most to disrupt the relationship were not close - they were the wave elections of 1983 and 1996, at both of which incumbent governments were heavily dumped. In both these cases, the Opposition won more seats than normal for the swing they got.
It's also not the case that the fit is getting worse. Since 1998, only two of the predictive errors for the graph above have somewhat exceeded the average: a lower than expected seat share gain for the Coalition in 2001 (following four consecutive better than expected results) and a higher than expected seat share gain in 2013. The other five are closer to the best fit line than average.
As applied to the present
At present crossbenchers hold six of 151 seats, so the target for a majority is 76/145, which is a 52.4% seat share. Labor is coming off a 46.9% seat share, so all else being equal needs a seat share swing of 5.5%.
The following chart shows projected seat share swings and ALP seat totals for various 2PP swings among the 145 current major party seats, based on (i) the graph above (ii) my own seat model for 2022. My seat model generally predicts that Labor will do a few seats worse than the historic average, largely I think as a legacy of the 2019 election leaving the Coalition with fewer close seats compared to Labor (and perhaps also it may be underestimating how well parties do in large-swing elections.)
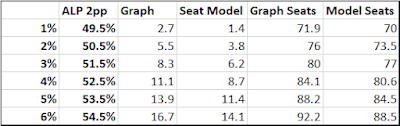
The historic pattern predicts Labor will be more likely than not to win a majority if it gets above 50.5% 2PP, while my seat model as of today wants to see 51.1.
Let's consider what might happen if Labor should be so fortunate as to bask in a 2PP of 52.5%. The graph predicts 84 Labor seats, eight more than needed. The model predicts four or five more than needed. The historic relationship has only been wrong by enough for an error exceeding eight seats three times out of 23, but if it is wrong it can be so in either direction, so the chance of Labor not winning a majority with a 52.5% 2PP is historically less than 10%. (On the assumption that the errors are normally distributed, which they may not be, it is 5%). On my more conservative seat model and assuming the same distribution of errors, the chance rises to 16%, but the seat model has already taken into account something likely to weaken Labor's performance, so the chance is probably not that high. Overall, past history very strongly suggests that if Labor gets a 52.5% 2PP, it almost certainly gets a majority - and even if it falls short, that would most likely at worst lead to a Labor minority government.
Now how about 51.5? For 51.5 there's much more uncertainty about a Labor majority - the graph model rates it approaching an 80% chance though my seat model thinks it's not that much better than even. But even on 51.5 for Labor, the chances of Labor at least winning more seats than the Coalition are historically very good - the graph model points to over 90% (though in my view that's overconfident) and the seat model to around 80%.
But what about the climate indies?
The so-called climate independents get much talked about in the discussion about how the 2PP might not relate well to seat swing. But that's got very little to do with Labor's seat tally, as in general the seats where climate indies are given any serious chance of gaining are Coalition seats. So all any wins by climate indies will do is knock down the Coalition's seat tally for a given 2PP and cause Labor to be more likely to overperform their expected seat share for that 2PP. (Possible losses for climate indies which would cut in the opposite direction are not so talked about - there's a general perception that Rebekha Sharkie (technically not an independent, but similar) and Helen Haines are very safe, but no known data underlying it.) It's in theory possible to imagine that the Coalition might get a very small swing to it but lose so many seats to climate indies that it fails to win a majority, though in my view that's rather unlikely too. (I think if Labor bombs out, the new indies will probably nearly all fare likewise.) There is of course potential for Labor to lose to other crossbenchers, like the Greens or Dai Le in Fowler, but Green seat gains in federal elections have proved harder than they look on paper in the past.
2PP vs seats
Here's another graph I prepared during one of these discussions - for elections since 1975 it shows how the national 2PP vote relates to the government's share of all seats. (I treat Whitlam Labor in 1975 as the incumbent - it had been sacked by Sir John Kerr just before the election but the election was in effect a vote about its performance.)

Red dots are Labor governments, blue dots are Coalition. The same comments apply here: the relationship is rather tight though not quite as tight as the first graph (87% of variation explained) and is not becoming less so despite crossbenchers taking more seats in recent years. The biggest outliers in this case are the Coalition outperforming the 2PP in 1998 (for reasons discussed further up the article) and 1980 (for reasons I haven't studied.)
The idea that an election might be a gripping seat by seat battle where the 2PP is irrelevant and every competitive seat could be the one to change the nation makes for a dramatic narrative for the media. But the verdict of history is that this narrative is bollocks. When the swing is really on, seats are more or less bound to fall, because seat swings follow probability distributions. It is only when the overall swing is small that the direction and magnitude of seat swing become more seriously uncertain. There is also no reason for the media to be spreading this stuff in the first place. Yes, Labor are way ahead in current polling and it is difficult to jazz up a lopsided contest, but one easy and sound way to jazz it up is to point to the history of polling leads closing down and governments recovering.
Of course, this particular election might in theory do something bizarre and unprecedented, but there is no basis for expecting it to do so based on the recent trend, nor is there any such in current polling. John Black's comment is simply wrong; there has been no breakdown of the 2PP vs seat share or the 2PP swing vs seat share swing relationships at recent elections, and there is no special reason to expect one this time either.
If you ignore the '98 recovery what's the recovery window for polling a 47 Newspoll?
ReplyDeleteKeating had a 46.5 four weeks out as well.
DeleteI'm sure this has been commented on elsewhere, but it's notable to me that even in the Coalition's worst polls, Labor is still polling around 36-38% of the primary vote.
ReplyDeleteThey're really depending on the Liberal vote to stay poor, and for the Greens/Indies to do a lot of heavy lifting for them...