CROSS-POLL AVERAGE 52.6 TO LABOR (-2.0 in two weeks)
Aggregate of recent polls assuming no overall house effects 53.2 to Labor
Recent Newspoll would not be likely to produce a hung parliament if replicated
Significant chance of hung parliament based not on most current polls, but rather on historic pattern of leads shrinking.
-------------------------------------------------------------------------------------------------------------
"Hung parliament club" is my nickname for a circle of usual suspects in the Tasmanian left and commentariat who continually argue that hung parliaments in Tasmanian state elections are both extremely likely and uncontentiously desirable. My view is that their constant public hankering after minority situations makes majority government more likely, not less. Federally, there have been echoes of this in Adam Bandt's constant poll-spinning that uses various unsound arguments to claim a "power-sharing parliament" is highly likely. However overall the federal variant of hung parliament club makes even weaker claims about the likelihood of a hung parliament than are seen in Tasmania, and then goes on to claim that a hung parliament could lead to crazy chaos and an immediate fresh election. The main suspects here are innumerate types in the Canberra press gallery, who seem to have listened to each other too much (or perhaps to party hacks or low-grade pollsters) instead of seeking any kind of informed take on how to interpret the numbers.
In Tasmania, hung parliaments are always a present risk because a major party usually needs a double-digit lead to avoid one under the state's Hare-Clark system of vaguely proportional representation. But the House of Reps does not employ PR and all that a major party currently needs for a majority is to win 5% more of the non-crossbench seats than the other. It doesn't generally take a big 2PP gap to achieve that, and we saw this for instance in 2016. At this election a hung parliament is a serious chance - and one that became far more likely as Labor's lead has shrunk - but it's still far from inevitable, and probably not even yet a 50-50 shot.
Newspoll Does Not Say Hung Parliament
The first ever (!) Easter Newspoll saw Labor leading the 2PP 53-47 off primaries of Coalition 35 Labor 36 Greens 12 One Nation 4 UAP 4 others 9. This was the equal highest non-major party vote in a Newspoll ever (29), matching four readings from 2017. It led to Chris Uhlmann claiming "neither can form government in their own right from there" and many other such claims in the press, probably from other journalists who listened to Uhlmann (never recommended, that). Various other items claimed Newspoll had revealed the possibility of a hung parliament, as if that possibility did not exist til 9:30 on Easter Monday, at which point it suddenly became almost certain.
I will start with this. Annastacia Palaszczuk's Labor team won a majority at the 2017 Queensland state election. They did this off a primary vote of 35.2% and a 2PP that was either 51.2 (my estimate) or 51.3 (Antony Green's). The preference flow to Labor overall in that election was much weaker than it has been at federal elections for a long time, but it was still enough. Clearly to claim federal Labor could not possibly win a majority off 36% is just silly.
Secondly, this whole genre of saying a side cannot win unless its primary is such-and-such has its roots in the application of irrelevant historical records. I noted last year that while Labor has never formed a majority with a primary vote much below 40, it could have done so at the last few elections had its primary vote been in the 36-38 range rather than the paltry thing it was. Since the recent increase in minor party voting Labor has simply not polled a primary vote high enough to lower its old mark for a low winning total. As such, Labor's 1990 record low majority-winning primary is a record begging to be broken, that may very well fall in Labor's next outright win.
My probabilistic seat model (basic details here) projects that if there was a 2PP of 53-47, Labor would win the 2PP in, on average, 82.6 of the 145 seats that are notionally held by a major party (I include Hughes in that tally). This is a higher estimate than the 80 one can get from the ABC's calculator, because the ABC calculator assumes uniform swing. The difference between our models comes mainly because a 4.5% swing lands in the lower reaches of a tight pack of nine Coalition seats. Here is how the two models see the Coalition's chances of holding each of them if the Coalition 2PP is 47.0%:
So while the uniform swing model gives the Coalition two of these nine seats for a 2PP of exactly 47, my model projects that in that case it would drop half of them. The odds for any one of those particular seats might be silly but that would be likely to cancel out. It would be extremely lucky if the Coalition held as many as seven of them, and if it did, that could be counterbalanced by losses elsewhere.
With Labor on for a median 82.6 of these seats (again, assuming it has 53% 2PP) it would need seven seats of crossbench wins or bad luck before it didn't win a majority. And there are just not that many seats where Labor would win the 2PP but lose to a new crossbencher. Chances exist in Higgins, Flinders, Brisbane, Kooyong and Ryan, but Labor would only be expected to win the 2PP in about two seats from that lot anyway, and most of them are not big chances to fall to the crossbench. Among Labor's regular 2PP wins, Griffith and Macnamara would be competitive for the Greens (especially as their 12% would exclude votes lost to climate indies, so their vote outside climate indie seats would be higher), Richmond is probably on too large a margin, and there is one other vaguely interesting chance which is Fowler. Overall I'd be surprised if Labor dropped more than a few seats to the crossbench out of this lot, so I'd expect the Newspoll if realised on election day to be good for about 80-81 Labor seats. Of course, Labor might get the wrong combination of bad luck and crossbench losses and fall short of the magic 76, but "might" isn't the same as likely or inevitable.
It's the Coalition that has to worry more about a potential low primary vote dragging a bunch of normally fairly safe incumbents down to 44% or below and at risk of losing to indies or Greens, but in this Newspoll it doesn't matter because the Coalition would be losing anyway.
None of this is to say a hung parliament won't happen or is unlikely - just that it is very unlikely if this Newspoll is repeated on election day, and the Newspoll doesn't shift the chance of it happening that much.
Leaderships
The leadership section of the Newspoll was grim reading for Labor. Anthony Albanese was down 11 points on net satisfaction to -14 (37-51). This is Albanese's worst netsat as Opposition Leader, and is also the biggest single-poll fall for an Opposition Leader since Bill Shorten dropped 16 points for no obvious reason in a somewhat wonky looking Feb 2015 sample. (He got 11 of them back the poll after, before losing another 8). Spookily, Bill Shorten also polled -14 (37-51) twice in the 2019 campaign, with five and four weeks to go, so for the moment Labor's card of Albanese being more popular than Shorten isn't playable.
Scott Morrison improved into negative single figures at -9 (43-52) again showing that his popularity is not a major issue, and he also increased his Better Prime Minister lead to 7 points (44-37). This is still an unflattering lead given the skew of this indicator to incumbents, but it's better than when he was only level-pegging.
Other Polls
The main other national poll driving media discussion has been the Resolve poll which had primaries of Coalition 35 Labor 34 Green 11 PHON 4 UAP 4 IND 9 others 4. The design of Resolve inflates the Independent vote, apparently through some combination of putting them on the readout everywhere, not allowing voters to be undecided, and perhaps other reasons. I get the last-election 2PP from this poll as 52.5% to Labor, but Resolve don't publish 2PPs. This was a large change from the previous Resolve but that is mostly because the previous one was a minor outlier. Many of the leadership ratings changes can also be attributed to the previous poll being generous to Labor, and it is unfortunate that so much attention was devoted to Anthony Albanese losing five netsat points (-4 to -9) as evidence of gaffe damage while Scott Morrison gaining eleven (-14 to -3) went uncommented on.
The "uncommitted" figure of 27% in Resolve attracted much comment. Uhlmann, among others, mistook this for "undecided". An undecided voter is one who when asked who they are voting for, says they don't know - pollsters vary if they measure this at the first pass, at the second pass (eg Newspoll) or at the first pass provided an answer is given at the second pass (uComms). Typically the figure is in mid to high single figures - most recently 7% in all of Ipsos, Newspoll and Essential and 6.5% in Morgan. In Resolve a voter isn't allowed to be undecided - they have to pick someone to continue in the survey (even if they have already decided to cast an informal write-in for "CAT, Fat"). Resolve's 27% is based on a completely different question that asks voters how committed they are to their vote - do they think that they are they already sure or are they not yet aware that they have locked it in? There would be a lot of voters who had largely made up their mind but weren't completely committed in case their chosen party did something gobsmackingly stupid or offensive, and it doesn't make sense to count these alongside the genuine don't-knows and no-ideas.
Essential last week had a 2PP+ of 50-45 to Labor (=52.6%) off primaries of Coalition 37 Labor 36 Green 10 PHON 4 UAP 3 others 5 undecided 5. I make this 51.8 by last-election preferences, continuing Essential's trend of more moderate readings than other pollsters. This week saw further narrowing with a 2PP+ of 47-46 to Labor (=50.5%) off primaries of Coalition 37 Labor 35 Green 9 PHON 3 UAP 4 others 5 (Essential's IND/others reading always seems implausibly low). I got this as 51.0 to Labor by last-election preferences, the closest converted reading from anyone since Resolve in November and the closest from Essential since September (though an Essential converted to 51.2 in February).
Morgan has just come out with a 55-45 headline to Labor based on its respondent preferences, which continually skew to Labor compared to previous election preferences. On last-election preferences I get this as 53.8 to Labor, the closest I have from Morgan since November.
Greens swings to win
After some rather indifferent polling earlier in the campaign the Greens have experienced what might be remembered as a Google It Mate bounce in Newspoll and Morgan, though there is no change in the other two polls. They are probably also picking up on disenchantment with Labor's campaign. Pollsters often overestimate the Green vote and their current polling (Morgan especially looking too high) may not translate to anything, but I think it's worth posting a list of seats the Greens are notionlly closest to winning, based on the level of 3CP swing from the winner to the Greens that would result in the Greens winning the 2CP vs the previous winner, provided that the other major party's vote didn't change. Note that in this case the swing has to occur evenly on both sides to necessarily count.
Coalition Seats:
Higgins (Vic) 2.6
Brisbane (Qld) 4.9
Kooyong (Vic) 5.4*
Ryan (Qld) 6.0
North Sydney (NSW) 10.5*
Labor Seats:
Macnamara (Vic) 3.1
Griffith (Qld) 3.5
Richmond (NSW) 5.6
Perth (WA) 7.4
Wills (Vic) 8.2
Canberra (ACT) 8.5
Moreton (Qld) 9.4
* = seats with prominent independents likely to affect Green vote.
Most of these seats shouldn't be taken at all seriously as Greens chances, but the latest polls suggest Higgins especially is interesting. The Greens made the top two in Higgins in 2016 but their candidate had adverse publicity in 2019 and Labor did well in such seats in 2019 anyway, dropping the Greens to a narrow third. On the other hand, Katie Allen gets a sophomore boost in Higgins, as does Josh Burns in the Greens' next closest target Macnamara. Allen was also one of the MPs to cross the floor on religious discrimination, which may assist her to hold off whoever is second in that seat.
Cross-poll averages and historic projections
Allowing for the first Ipsos being too old to place much weight on it, I get a cross-poll average of the current polls of about 52.6% to Labor, assuming no average house effects. Allowing some weight for previous polls I get an aggregated reading of 53.2% to Labor. There's a fairly strong argument that one should assume house effects (discussed last time) in which case my deduction from the above would be 0.7. It's no longer the overwhelming lead that it was, with Labor dropping a remarkable 2% on the cross-poll average of the latest polls in two weeks.
The slide for Labor has been widely attributed to Anthony Albanese's first-week gaffes, but the previous Newspoll was before any of the gaffes and still had the same 2PP. It may represent, for instance, a delayed Budget bounce, or voter concern dissipating about cost of living pressures. The current Newspoll indeed points away from the gaffes as the main source of change because there is no reason for voters concerned about these gaffes to move to the Greens rather than the Coalition. As suggested by William Bowe on Twitter, disappointment about Labor from the left (especially on Jobseeker rates) is another candidate that is a better fit.
Linear regressions based off the past history of leads narrowing from this point now suggest that if the relationship of results to leadin polling is normal, the median 2PP on election day is now about 51.1 or 51.2 to Labor. My seat model on average for that 2PP gives Labor 2PP wins in 76 of the 145 current 2PP seats, but the road to a hung parliament becomes very much wider (including Labor being just a little bit unlucky or dropping even one of its 2PP seats to crossbenchers). The Morgan and Essential results, unlike Newspoll, push further in the direction of a hung parliament because they replace higher results for Labor by the same pollsters.
At the moment polling history is saying that an ALP majority is only touch and go. (It's still not saying that a hung parliament is more likely than not, because there is a substantial chance still that the Coalition wins outright too). Because we are coming off a polling failure, I am not saying that polling history is necessarily predictive - polls could be still affected by the same problem in some way, or they could be overcompensating. For that reason while things are vaguely close I'm trying to avoid making statements that sound too predictive.
It's also important that polls are still not very predictive at this stage. At this stage in the past polling has only explained about a third of variation in final 2PP results. A landslide win to Labor or a swing to the Coalition are still within the range of possibilities.

There is also a question of whether we should factor in the skin Labor has already lost as evidence that it is less likely to lose more in coming weeks. If that is so, Labor's current position is better than past trends indicate. For the time being though, this is a far more competitive election than it looked a few weeks ago.
Fear Of A Fresh Election
The hype from some in the commentariat, and scaremongering from the Barnaby Joyces of the world (hang on, there is only one Barnaby Joyce, thankfully) suggests that if there is a hung parliament there could be instability leading to a prompt second election. Comments from Kooyong candidate Monique Ryan that she would not provide either side with confidence and supply until they did more about climate change have played into this. But actually whatever the numbers this sort of chaos isn't likely. A few weeks of negotiations as in 2010 followed by a relatively stable parliament is the more likely outcome. The primary reason for this is that the incumbent Prime Minister is entitled to continue in office to test their numbers on the floor of the House. They do not need to have the positive confidence of the House to continue, they can just go on until they are voted out. So it doesn't matter (in terms of chaos) if there are some crossbenchers who are refusing to provide immediate support to either side - it only matters if those crossbenchers are actually willing to vote for motions of no confidence in both. If the crossbenchers vote to bring down the Coalition government, but then also vote against confidence in a Labor government, then the crossbenchers look like wreckers and are at risk of losing their seats at a second election. More likely the crossbenchers would not vote for a no-confidence motion in the Coalition government in enough numbers to bring it down until they had made arrangements with Labor to support Labor into office on terms they were happy with.
Seat Polls
Senate polling is discussed in my Senate prospects piece and Tasmanian seat polling in my Tasmanian House of Representatives guide.
Recent seat poll reports have included:
* Redbridge polls of Bass, Longman, Greenway, Paterson. No 2PPs are provided but on the primary vote numbers the government would lose Bass and gain Greenway.
* A uComms of Kooyong with Monique Ryan supposedly winning 59-41. AAP in a widely syndicated report managed to report this without including any mention of who the poll was commissioned by or what the primary votes were. It turns out it was commissioned by Ryan herself; the Herald-Sun had incomplete primaries of Frydenberg 35.5 Ryan 33.8 Labor 12.8 Greens 11.7. (Ryan would win easily on these numbers but perhaps not 59-41). Separately unnamed Liberals were reported as having Frydenberg on 44 in internal polling - a number from which he would win based on the 2019 breakdown, but might lose if Ryan's vote was above 30. There were no details of sample size, pollster or treatment of undecided voters in the Liberal polling, which may have simply been small-sample snapshots. As concerns the uComms, I'm increasingly distrustful of robopolls that weight only by age and gender after flops in the Tasmanian election and the SA seat of Stuart, and results released by candidates tend to favour themselves (because if they don't like the results, they don't release them). This election will be an interesting test of uComms' accuracy.
* A Climate 200 commissioned Community Engagement poll of North Sydney was partly reported with primaries of Liberal 37.1 Tink (IND) 19.4 Labor 17.3 Green 8.7 UAP 5.6 (not likely in this electorate). Presumably undecided are not redistributed but this is not clear; if they are not then Tink would need 78% of all preferences to win, which would become something like 90% from Greens and Labor (suggesting Trent Zimmerman would narrowly retain). Both Climate 200 and Community Engagement have had poor records of poll transparency and the full details of this poll need to be published.
Betting
I like to keep tabs on seat betting, mainly because a lot of people think that betting is reliably predictive (it isn't) and it takes a lot of evidence to shift them off that prior.
This week saw the headline betting briefly have the Coalition in front between the releases of Resolve and Newspoll; Labor is now favourite again with around an implied 55% chance of winning.
Based on my usual methods I have the following seat betting list:
Expected ALP gain (not close) (1): Swan
Close expected ALP gains (6): Reid, Boothby, Chisholm, Bass (tied in one market), Braddon, Pearce
Tied (1): Longman
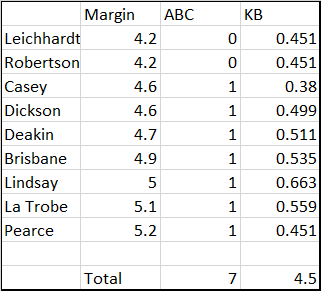
Close expected Coalition holds vs ALP (12): Hasluck, Tangney, Banks, Sturt, Deakin, Bennelong, Lindsay, Brisbane, Flynn, La Trobe, Leichhardt, Robertson
Close expected Coalition holds vs IND (7): Curtin, Nicholls, Goldstein, Kooyong, North Sydney, Wentworth, Mackellar
Close expected Labor holds vs Coalition (2): Gilmore, Parramatta
Close expected Labor hold vs IND (1): Fowler
On raw favourites these markets suggest Labor gaining 7.5 seats for totals of Labor 76.5 Coalition 68.5 others 6. Taking into account close seats Labor's position is slightly better at 77.4 with the Coalition on 65.2 and others 8.4.
Poll-Shaped Objects: Worst Of The Worst
I may not have time for a full-scale April poll-shaped objects article but I feel I should briefly indict:
* news.com.au for an opt-in survey that included a voting intention question that listed dozens of parties (several no longer extant) in alphabetical order then amazingly reported that the major party vote was lower than the last election. The number of parties listed exceeded every House of Reps ballot paper ever seen.
* the Murdoch tabloids, which followed up some very interesting work about historic litmus booths with supposed exclusive polling finding Anthony Albanese was poorly known - the supposed polling was simply an unscientific convenience vox pop sample in some of those booths
* Compass Polling, a non-transparent pollster with a history of producing conservative culture war results, which was reported by Sky as finding various things about whether voters thought trans women should be allowed to play women's sport. However what was available showed at least that the questions were loaded with emotive/arguing-the-case terms like "forced" and "biological males" - quite aside from there being no publicly available data on methods.
* and above all the AFR, the online front page of which reported an "Ipsos poll" making unflattering findings about Albanese, only for the supposed "poll" to turn out to be focus groups with a combined sample size of ten (and not even a representative sample at that - undecided ex-major-party voters who were unsurprisingly grumpy about everything). As well as the sample size being ridiculously small, the reporting was abysmal, making it impossible to tell whether some claims were even summaries of the groups overall or comments of a single voter. The AFR's audience is supposed to be numerate and serving up this rubbish should be a deep embarrassment to all concerned.
Speaking of poll shaped objects I came across this today. It just seems to be Greens volunteers cornering people, but is getting reported here as 'polling'. Not sure its even poll-shaped enough to qualify as a poll-shaped-object. https://www.couriermail.com.au/questnews/southeast/shock-poll-greens-could-win-second-federal-seat-in-this-brisbane-suburb/news-story/51a573519f5f54873467464d293be06b
ReplyDeleteYes I saw that one too. They claim it is accurate but to my knowledge results have not been published in the past in a way that could allow those claims to be tested - which is odd given that they *have* published actual polling in the past, which in their case has been a lot closer to the mark in general than the Greens in other states. It is hard to believe that this method would work, or if it does work a few times that is probably just lucky.
Delete