I haven't seen any other articles on these subjects so some coverage of turnout and informal votes in the Voice referendum.
The most important thing to know about Voice turnout is that it was a lot higher than many people said it was going to be. It indeed managed to just beat the 2022 House of Representatives turnout, but this is no great miracle alone given that the 2022 election was COVID-blighted. What makes it more impressive was that it was acheived against the backdrop of an enrolment drive that made the roll more complete than ever before, putting more voters on the roll who had a relatively low chance of voting. Another factor that makes the near-90% turnout commendable is that six years ago there was a mass voting type exercise that was voluntary, and there was some potential for confusion about whether voting in the referendum was required.
Just a disclaimer before I get much further: when I post graphs with low r-squared values (percentage of variation explained) I come across a few readers for whom a little knowledge of statistics is a dangerous thing and who will, sometimes irately, insist that anything below r-squared equals 0.3 or so is worthless. In fact electoral statistics are very messy and even r-squared values of a few percent can be statistically significant if there are enough data points. The important thing with such values is to be especially cautious about assuming causation since the causes of such patterns are often to be found elsewhere. For instance, in the 1999 Republic referendum, seats with high Yes votes had low turnout, but that isn't because high support for Yes in an area caused people to not vote, it is mainly because inner city seats that tended naturally to vote Yes also have high numbers of transient young voters (who themselves would be likely to vote Yes if they voted at all).
Turnout
It's a happy thing for analysts that turnout for the Voice referendum as a share of enrolment (89.92%) was virtually identical to turnout for the 2022 House of Representatives election (89.82%) meaning that it's very easy to compare turnout across divisions. [EDIT: Final turnout increased to 89.94% after roll reconciliation saw a late slight reduction in the number of enrolled voters.]
The best explainer of 2023 turnout was in fact 2022 turnout. Certain seats have naturally high or low current turnouts that cut across both these votes in an extremely obvious way. The best case is Lingiari which had a turnout in the mid-60s in both cases and has therefore been left off the chart below. The next three lowest for both votes also have high Indigenous enrolment (Solomon, Kennedy and Leichhardt) and in the mid-80s there are a pack of outer suburban seats such as Blaxland, Burt, Calwell and Forde and also some inner city seats with high enrolment churn like Sydney. I am not too sure what Moncrieff's excuse is. The high end is a mix of tealy seats, regionals and urban seats (eg Berowra, Mayo, Kooyong but also Eden-Monaro, Corangamite, Franklin, Deakin, Hughes and Macquarie).

Overall there was not an even remotely significant relationship between 2023 turnout and Yes vote, which is not surprising since some high Yes areas were inner-city seats with relatively low turnout:

This is quite a different pattern to the Republic vote, but this is probably because many divisions have become low-turnout seats that used to be low-enrolment seats; the Republic saw a tendency for strong Yes seats to have low turnout:
The two seats with the biggest negative turnout change as a share of enrolment were Lingiari and Leichhardt. The main significance of this is that these seats saw increases in Indigenous enrolment, but Indigenous voters have lower turnout rates.
Beyond that, seats with negative turnout change were often outer-suburban (Burt, Blaxland, Werriwa, Cowan, Brand, Calwell, Swan, Pearce, Watson). These seats have generally high Labor votes and tended to record moderately low Yes votes, around the 30-40% range. At both ends of the Yes spectrum there was an increase in turnout, but it is a very weak relationship (especially at the Yes end) and should not be assumed to be causal.

In the case of Lingiari, there was a large increase in enrolment (among the largest in the nation) and there was also the largest decline in turnout; are enrolment increase and turnout decline linked even as a corellation? Only extremely weakly if at all (not even strongly significant despite the number of data points):

The seat with the biggest enrolment growth for the Voice was Lalor (+10%). What I think is happening here is that some seats have had high turnout growth through population increase and others through improved enrolment, so some of the high-increase seats are not gaining a lot of low-probability-to-vote electors. At the other end some inner city seats, which are likely to vote Yes, have had enrolment declines. So nothing useful to see there.
Informal Votes
Informal voting was the subject of plenty of nonsense at this referendum. There were internal claims by the No campaign that AEC treatment of ticks and crosses could confer an edge to Yes as high as 5%, but scrutineers had such difficulty finding actual tick and cross votes that I have so far seen only very rare reports of a scrutineer seeing even one.
There was also speculation that there would be a substantial deliberate informal vote, for instance in a Joe Hildebrand article (which I choose not to link) based on a sample of one cabdriver. It was claimed in various quarters that voters would vote informal in confusion or disinterest, or because they thought the Voice was a matter for Indigenous voters and none of their business. Some Indigenous groups (for example the Blak Greens) called for voters to vote either No or abstain. In an interview with some currency in the socialist and anarchist left online, veteran Aboriginal activist Professor Gary Foley said "I can’t really see any good reason to either vote yes, or to vote no."
For all this, and for all other arguments that the Yes case was grossly defective while the No campaign was repugnant, informal couldn't even muster 1% at the Voice referendum. The 0.98% result came in as the third lowest ever behind the 1999 Republic (0.86%) and 1999 Preamble (0.95%), both also votes at which there was apparent scope for personal boycotts but hardly anyone did it. By comparison, deliberate informal voting at elections runs at around 2-2.5%.
The pattern of informal voting is interesting because it resembles the pattern of turnout change:
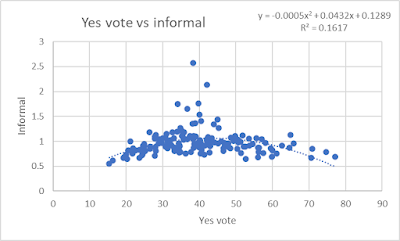
The divisions off the top of the chart are the usual suspects in culturally diverse Western Sydney and to a lesser extent north-western Melbourne: Blaxland, Fowler, Watson, McMahon, Werriwa, Calwell - all of these generally have high informal rates at Reps elections. But what is unusual is that Maranoa and Flynn have come in with the lowest informal rates in the country, as well as the two highest No rates. Other, mostly Queensland, seats with high No and very low informal include Kennedy, Capricornia, Groom, Hinkler, Durack and Herbert, while seats that voted Yes with very low informal include seats more commonly seen on the lowest-informals list: Ryan, Canberra, Brisbane, Kooyong, Melbourne. Only one of the sixteen lowest informal seats (Tangney) recorded a Yes vote within 10% either way of the national average.
This pattern, however, was not seen at the 1999 Republic referendum. In that case while there were a couple of highish Yes divisions with very low informality (Ryan and Bradfield), on the whole informals increased as the Yes vote went up. Maybe this was because Yes votes were higher in the naturally high-informal Labor seats, and/or it could have been that an informal protest vote about the model became commoner in pro-Yes seats.


No comments:
Post a Comment
The comment system is unreliable. If you cannot submit comments you can email me a comment (via email link in profile) - email must be entitled: Comment for publication, followed by the name of the article you wish to comment on. Comments are accepted in full or not at all. Comments will be published under the name the email is sent from unless an alias is clearly requested and stated. If you submit a comment which is not accepted within a few days you can also email me and I will check if it has been received.