No projected ahead in every state, but significant doubt about Tasmania
Tracking since election (no house effects)

(Focaldata expected to be added)
Tracking since April (estimated house effects included)

In this graph polls are adjusted based on my estimate of their house effect relative to other polls. So if a poll has on average had a high Yes vote then I adjust it downward, and if it has on average had a high No vote then I adjust it upwards. There is an appearance that the decline in the Yes vote is smoothing out somewhat but it is not conclusive and may be overfitted.
Major Polls
Newspoll (13 October)
The final Newspoll has had a swing back to Yes from its previous dire result but Yes is still losing 37-57, and losing in every state (NSW 41-54, Vic 43-51, Tas 38-55, SA 33-60, WA 28-65, Qld 30-65) with a sample size of 2638. Newspoll follows Resolve, Essential and Morgan so far in all getting swings (mostly modest) back to yes in their last compared to second last polls, with only YouGov contradicting this narrative of outfits with a reasonably recent last poll. I'll process this through all the usual charts and stats gradually now.
JWS (13 October)
JWS has released a poll with first pass 36-48-16, second pass 39-52-9 and 43-57 after excluding (not forcing) undecideds. They find a 29-71 split among voters who have already voted (which would be a mix of postal voters and prepoll voters). This pushed my aggregate up to 41.3.
Morgan Update (12 October)
Morgan expanded their previous poll, adding over 500 respondents and reinterviewing undecideds to get a new and final result of 44-51-5, which they project as 46-54 after rounding and on the assumption that two-thirds of the hard undecideds vote no (on the numbers that would have been very close to rounding to 45-55). This took 0.1% off my aggregate, mainly because it moves forward to October 12.
YouGov (Release 12 October)
YouGov final poll has 38-56-6, a move of 3% from undecided to No.
Resolve Report (Release 11 October)
Resolve have released a fantastically detailed report of their Voice polling to date. Their monster poll last week was 43.9-56.1 to one decimal. The breakdown among self-identifying Indigenous voters (n=420) is 59-41, a long way from the 80% promoted by the Yes camp in outdated polling. (I have seen another poll result coming with about half the sample size and a result in the mid-high 60s, to be discussed further when released).
Morgan (Release 10 October)
I was expecting Morgan to release an extended version of last week's 37-46-18 poll but instead they've released a fresh sample also of just over 900 respondents and this one has been much better for Yes, coming in at 41-45-14; they've also included a second-prompt result for the first time, which is Yes 45 No 50 undecided 5. (Again they say they expect remaining undecideds to swing to No). A possible explanation of what is going on here is bouncing caused by small sample size; if the two are merged then a 39-45.5 result would show a similar shift from Morgan's previous larger online poll to that seen in others.
The impact of the Morgan on my aggregate is very minor, adding just 0.1% to the Yes vote, because it responds by ramping up its estimate of Morgan's house effect and largely neutralising what would have otherwise been an outlier.
Newspoll (Release 8 October)
Newspoll released the single worst result for Yes of the whole campaign, a 34-58 Yes-No result (a 2% swing from Yes to No) which comes to just 37% on a two-answer basis. This went in the opposite direction to Resolve (see below) and is also considerably fresher, since Resolve was taken over a two-week period. That said the sample size is only a quarter that of Resolve. Highlights/lowlights depending on perspective included fewer than half of Labor voters supporting Yes (48-42), following YouGov finding likewise, and the first case so far of No winning an 18-34 breakdown (46-49). The poll was taken Oct 3-6.
Resolve (Release 8 October)
I don't know if this is the final Resolve poll but it is certainly a big one! The Resolve poll of 4728 voters taken Sep 22 to Oct 4 had Yes up one to 44-56 (forced choice) from 38-49-13 prior to forcing undecideds. This poll continued to find Yes ahead in Tasmania, which has been a standard finding in Resolve and Morgan panel polling but it would be interesting to see numbers from anyone else. The poll was far more positive on Labor voter support with a 67-33 forced choice split (compared with just 53% in Newspoll two-answer preferred) but it's possible the question wording which notes that the Government has initiated the referendum has contributed to that.
The Resolve question is very long.

An interesting methods note is that Resolve employs filter for " those likely to turn out and cast a valid vote." Both Resolve much earlier and Newspoll recently have found close to 10% saying they are not likely to vote or to vote validly, but this will include some voters who discover that voting is compulsory having previously not known such. (The non-voting rate could well be over 10% but that will include accidental non-voting).
Focaldata (Initial release 7 October)
The richness of the Voice polling is such that it has even attracted a surprise entrant from overseas, with UK pollster Focaldata announcing a giant MRP (Multiregional Regression with Post-Stratification) poll that had Yes trailing 39-61 forced choice. I am awaiting some further details of this poll including exact question wording and dates in field (the sample size is 4500). However what has been available includes the individual seat projections. These won't necessarily be close for all seats, because of specific local aspects (especially high Indigenous voter proportions eg Lingiari) that may not be captured by the demographics or because of randomness affecting the individual seat samples, but on the whole the MRP projects Yes to triumph in the ACT but nowhere else, and to win just 22 electorates. These are:
NSW: Sydney, Grayndler, Reid, North Sydney (only teal seat though Kooyong and Wentworth round to 50-50), Kingsford Smith, Greenway (!), Bennelong
Vic: Melbourne, Macnamara, Higgins, Wills, Cooper, Chisholm
Qld: Brisbane, Griffith, Ryan (all Green seats)
WA: Perth
SA: Adelaide
Tas: Clark
ACT: Canberra, Fenner, Bean
NT: (none)
While I have not seen all details, Focaldata say that there are roughly twice as many soft Yes as soft No voters, and also that relatively safe Labor seats with low population density are likely to vote No. They have a finer age breakdown than other polls, with the 35-44 age group the youngest to favour No (45-55). (Update: Blog post is up; I believe crosstabs will also be released.)
The poll has a c. 250-vote self-identified Indigenous subsample with a result described in the post as 70-30 to Yes; I got 69-31 from crosstabs that I have seen, though with adjustment of Aboriginal vs Torres Strait Islander responses to match the national population this comes down to about 66-34.
The blog post claims that misinformation has not led to the huge no lead and cites the fact that of those respondents who thought the No campaign had been better than the Yes campaign, only 7% cited misinformation as the main reason. But "better campaign" is ambiguous and many Yes voters would think their side's campaign was more rational or more motivated even if they thought Yes had been outcampaigned. Also, voters who had succumbed to misinformation would be more likely to pick one of the other options rather than to agree that No campaign misinformation had helped No win.
Sky has falsely described this poll as a "leaked" poll. Focaldata openly tweeted about their poll results and offered them via DM to anyone interested.
Adding Focaldata to my aggregate reduced the Yes vote by 0.3%
State aggregated estimates
This section gives aggregated estimates of the Yes vote for the individual States and the combined Territories based on national polling. Figure in brackets is difference from the aggregated national total.
NSW 43.5 (+2.2)
Vic 46.1 (+4.8)
Qld 33.7 (-7.6)
WA 36.0 (-5.3)
SA 39.9 (-1.4)
Tas* 45.5 (+4.1)
Previous Territories Combined estimate has been determined to be very unreliable because of high variation in remainders between polls (FWIW it was currently running at 49.5)
* = limited data
By comparison the FocalData MRP (based on a simple average of electorates without adjusting for likely turnout variations except in the case of ACT vs NT) has something like NSW 41.8 (+2.8), Vic 41.2 (+2.2), Qld 32.4 (-6.6), WA 35.5 (-3.5), SA 43.2 (+4.2), Tas 44.0 (+5.0), Territories Combined 52.1 (+13.1). The FocalData MRP is not included in my state estimates, on the assumption that its MRP modelling crosses state boundaries.
Tasmania has consistently shown a Yes lead in recent Resolve and Roy Morgan subsamples and is now the most pro-Yes state in my state projection off the national total. However because the data for Tasmania comes from so few pollsters and Tasmanian breakdowns based on small samples have a history of being unreliable, the aggregate is still influenced by earlier Newspoll and YouGov readings that were less comparatively flattering for the Yes vote in Tasmania.
Undecided Vote
A figure of one-quarter undecided has been widely quoted in the media but media love to print hype stories about huge numbers of voters being undecided, and the only "evidence" for this claim appears to be that this was found in Labor polling of voters in South Australia. No details of that polling are available for scrutiny, and there is a lot of confusion between undecided and soft voters that may be boosting this narrative too. The picture for the undecided vote where pollsters use just a single question to gauge whether voters are undecided is somewhat messy - on balance it appears to have fallen to around 14%:

Among pollsters that use a second prompt and therefore classify leaning voters as decided there has been a similar and much clearer decline in undecided voters from about 11% to 7%. By comparison at the last federal election it was about 6%, but in earlier federal elections it would often make it down to a few percent. So indecision is higher than at a federal election, but not massively so.

Yes results in various answer modes:
1. Forced choice

Magenta - Resolve, Red - Redbridge, Purple - FocalData
Only three pollsters are known to me to have been using forced choice recently (Essential ceased doing so). The average forced-choice Yes vote is projected at around 39% but the main two houses involved have evident house effects relative to each other and Resolve has a strong house effect on two-answer preferred.
2. Double-prompt undecided allowed
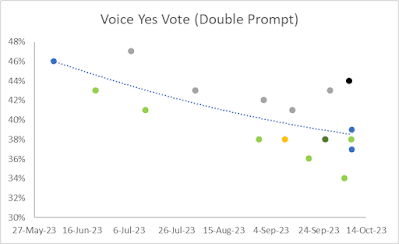
The double-prompt Yes vote is running at around 39% but the graph is heavily dominated by Essential and Newspoll results, which consistently fall on opposite sides of the trendline.
3. Single-prompt undecided (may or may not force choice as well)

Magenta - Resolve, Light blue - Freshwater, Black - Morgan, Orange - DemosAU, Purple - Focaldata, Dark blue - JWS
The single-prompt yes vote is running at about 36% as a linear trend but with a fair amount of variation, and it's also significant here that Morgan online (which has a large house effect on two-answer preferred) is one of the commoner polls of this type. A trendline could be drawn with a u-shape and a much higher value here with yes at about 39% but it would be heavily influenced by Morgan coming in only at the end.
Minor Polls And Poll-Shaped Objects
Supposed No campaign Indigenous polling (Oct 8): The Herald-Sun reported claims by some source from the No camp to have collected Indigenous voter numbers in polling in February and May. Supposedly Indigenous voters were 60% supportive in February (cf 59% generally) and 57% (cf 54% generally) in May.
These claims should be treated with distrust and for this matter disgust (at the Herald-Sun for learning nothing from the Andrews-losing-his-seat debacle) until the following details are published: name of pollster, full list of all question wordings, basic details of research panel, days in field, sample size, weightings. At this stage there's no evidence that this polling even exists. The two Uluru Dialogue polls had some issues and are now extremely out of date but at least they were transparently documented and by reputable pollsters.
It also seems hard to credit that if the No campaign had reliable evidence that the Yes campaign's claims about Indigenous voter support levels were false, that this would have been held onto until this late in the piece.
Media "exit polling" (various): Some media "exit polls" of prepoll booths have been seen. These have many issues. They are taken by people who are not polling professionals, and with insufficient data about methods and timing. Exit polling may be prone to social desirability bias (if talking to a person, a voter may not admit to voting No). Exit polling is likely to be stratified in the way voters vote - Yes voters may be more likely to vote later in prepolling rather than earlier, and perhaps later in the day rather than earlier. Nonetheless a large enough number of these media reports is sometimes useful. In the 2022 election after adjusting for prepoll skew, these media "exit polls" provided a fair portent on average of the overall swing against the government, though many of the individual samples were way off.
Overall the early exit polling reports were consistent with a comfortable picture for the No vote. The West Australian reported a very tiny (100 voters) sample from a Perth CBD prepoll but a 51-49 lead for Yes in this booth is not good since this should be a strong Yes area and was 65-35 to Labor at the federal election. Adelaide Now reported a 42-58 sample from five prepolls across Adelaide; three of these are stated, which were on average Labor-leaning, but without the full list it's hard to say more.
On Oct 12 the Courier-Mail reported what it said was a Queensland sample with 115 yes to 101 no but it's quite difficult to make the partial numbers add to only that many. Brisbane City Hall was given as 80% yes in a tiny sample with other Brisbane prepolls also strong; on the other hand Logan close to three to one against and Townsville 63% No. Prepolls at the later end of prepolling are more likely to lean left, but I am not sure how strong that effect is.
Opt-ins: Various opt-in TV and media "reader polls" continue to be seen, including a Seven one following a TV item about the referendum, and also opt-ins in the Murdoch tabloids and on news.com.au. These are useless except as an indicator of just how unappealing the Yes case is to people who read Murdoch tabloids, with one reader poll with over 25,000 respondents in the Herald-Sun having Yes running as low as 9%. At best these reader polls represent only the skew of the media outlet's audience, and they are also prone to stacking. But it is interesting that the Voice is so badly received among readers of these papers - consistent with its general failure to attract support outside the left.
Pollinate (Oct 10): Pollinate may be an accurate poll for all I know, but it won't germinate unless it sows the seeds of at least minimal detail transparency. A media report indicates it has a 35-47 result, with No up from 35-44 in a previous wave. It also seems to have offered a forced choice between "I am open to new perspectives and changing my values and beliefs” and “I live and stand by my values and beliefs”, and regarded those who picked the first as more open-minded. (Yuck.)
Scare Australia WA (Oct 13): The No campaign group that I have renamed because of their nonsense about ticks and crosses have told the West Australian their polling has a 36-59 result in WA but there are no details except the sample size (637) and there being a surprisingly low 5% described as soft on either side (I wonder if these were actually leaners). This level of detail is inadequate; media should do much better than that.
GIC (Oct 13): Something called GIC had a result of 38-45-17 on 15-22 Sept and has been reported by the Herald Sun but I can find no further information so far.
HI Kevin. Great work as usual. Can I ask you what polls you might expect between now and saturday? the final polls we might see?
ReplyDeleteMorgan is still in field, Newspoll habitually in elections puts out a final poll on Friday night, it wouldn't surprise me to see a further Essential, Freshwater and JWS haven't been seen for a while, there may be others.
Deleteso in short, quite a few more polls to come!! that Morgan poll from yesterday seemed to be way at the upper end of the scale for YES...can I ask what sort of "house effect" you see for them?
DeleteAfter yesterday's my estimate of the house effect for Morgan online cf polls as a whole is 4.9% pro Yes
DeleteThank you Kevin for your usual highly erudite and dispassionate analysis of the polls. Always such an authoritive source.
ReplyDeleteI'm also highly amused by those who commission these polls and laughably analyse their own polls in isolation of the other published polls
HI Kevin. do you get to see polls in advance of general release normally? I see you mentioned it above re indigenous voting
ReplyDeleteSometimes - not a common event but happened twice today.
DeleteThere is another breakdown coming from a different poll which is better for yes but the sample size is only half as large. All polls of Indigenous voters are subject to the pitfalls of self-identification (which may be dishonest or mistaken) and difficulty sampling the about 16% of Indigenous voters who live remotely. Overall however this is consistent with a dropoff among Indigenous voters similar to that in the general community.
ReplyDeleteExcellent analysis as always and thank you Kevin for providing your erudite contributions to polling with a dispassionate eye and sophisticated detail
ReplyDeleteHI Kevin. Just a quick question. The media seems to be going on about potential low turnout and what that might mean for the different camps. Do you have any views or data that might shed light on such a discussion? thank you
ReplyDeleteA lot of nonsense is being written on the subject including a false claim that in 1999 No-voting areas had low turnout. In fact in 1999 the reverse was true at electorate level.
Delete