The results of this year's half-Senate election are all in so it's time to observe how our still relatively new Senate system performed at its second half-Senate test. For previous assessments see 2016 part one, 2016 part two and 2019 (single article). I have changed the title mainly so I am at liberty to add pointless fluff about candidates who finished last. On the agenda for this issue are: proportionality, blocked Senates, how dreadful this election would have been under Group Ticket Voting, winning vote shares (with a focus on Babet and Pocock), preferencing impacts, just-voting-1, exhaust, informals, below the lines, How to Vote cards, blank above the line boxes, and a special schadenfreude section at the bottom.
Senate voting was reformed in 2016 to remove the problems caused by preference harvesting under the old Group Ticket Voting system, under which Senators were being elected off very low vote shares as a result of networked preference deals and a system that coerced voters into sending their preferences to parties they did not support. This was not only discriminatory and wrong, but also a threat to the integrity of the electoral system because of the ease with which minor issues could cause a count to collapse. A great many alarmist predictions were made by defenders of the (no longer defensible) GTV system, and most of those have been debunked already. However in 2022 there are two new opportunities to test predictions about the new system. Firstly it is the first time we have had a Senate composed entirely of half-Senate election results. Secondly, it is the first time Labor has come to power in the House of Representatives under the new system.
Proportionality
As previously noted, the 2016 DD was amazingly proportional, even though Senate elections will not necessarily be so because of state-based malapportionment. It's harder for half-Senate elections to be proportional because of the "district magnitude" issue of only having six seats elected per state (which makes life hard for parties that only get a few percent of the vote, so how did 2022 scrub up?
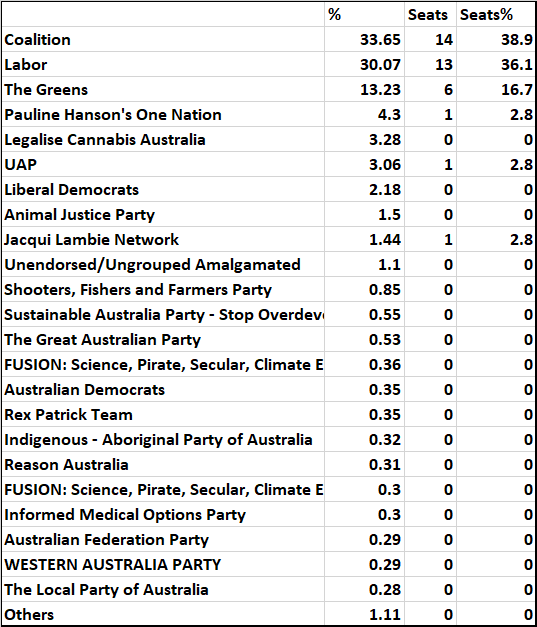
Firstly the simple national votes to seats conversion (though this is a silly yardstick because of malapportionment and the territories only having two seats each):
As usual all the big three parties have outperformed their vote share, as a result of those parties that are too small to win seats being excluded and their preferences being distributed. However this time it is Labor that has done better relative to its vote share than the Coalition and Greens.
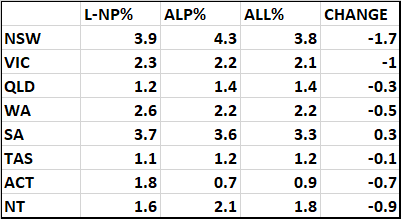
My yardstick for proportionality for the state contests is to look at the number of state seats won compared to the average vote per state. Here are the results on that indicator:
On a state basis, the relative advantage to the big parties is about the same as each other. This is largely not because of state malapportionment. It's because Labor won two seats to one from the two Territories despite its edge in the ACT being worth only 0.16% of the national primary vote.
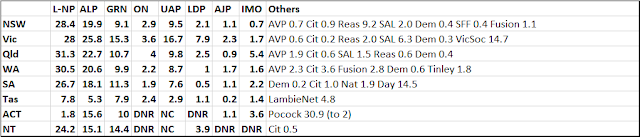
Every party that averaged 1/36th of the primary vote per state won in a state, except for Legalise Cannabis which had too even a spread of votes across the state and had poorer preference flows compared to One Nation (and in Victoria's case UAP). The left vote is more concentrated among Labor and the Greens while the right vote is more dispersed, so what the left micro-parties miss out on is also Labor and the Greens' gain. One Nation was again, however, not fully rewarded for its vote and preference share, because of its habit of not quite getting over the line outside Queensland. At this election One Nation was within 0.5% of winning instead of the UAP in Victoria, a close seventh in WA, and also seventh in NSW and SA (by modest margins) and Tasmania (distantly). In Tasmania it would have won had the Jacqui Lambie Network not contested.
Had this election been a double dissolution, I estimate the result would have been Coalition 28 Labor 26 Green 12 One Nation 5 Legalise Cannabis 2 UAP 1 JLN 1 and Pocock. Legalise Cannabis would have won in Victoria (very narrowly) on my estimates as well as Queensland. One Nation would have been over-represented and UAP under-represented because One Nation outpolled UAP in five states to one. Labor and the Greens would have had no more seats from this double dissolution than from the combined 2019 and 2022 half-Senates, but would have had more potential helpers.
Fear of a blocked Senate
For the purposes of this section I refer to Labor and the Greens collectively as "the left", to the dismay of the most partisan supporters of either. The Coalition, One Nation and UAP are considered to be "the right".
As noted in 2019, hacks within the ALP who were opposing Senate reform in 2016 raised the fear that Senate reform would lead to the Senate that will not flush, where the right always won half the seats at half-Senate elections making it impossible for the left to ever govern. No modern simulation has ever supported this concern, but simulations are not full substitutes for an actual case of Labor coming to power. And now that that has happened it turns out of course that Sam Dastyari's concern about blocks of three right Senators "forever preventing a progressive Senate" was absolute nonsense. Considering Jacqui Lambie Network as neither left nor right (it's not near consistently either, though it is more left than it used to be) the right has failed to win three seats in Tasmania in either 2019 or 2022. It also won only two in Western Australia in 2022, cancelling out four in Queensland in 2019. But the right also dropped a seat in the ACT for the first time this year, leaving it three seats short of the ability to block. Even if I count David Pocock as centre rather than left (we'll see ...) a 38-35-3 Senate is hardly bad for Labor as a total of an election it lost 48.5-51.5 in the Reps and one where it won the Reps by about 52.1-47.9.
The concern about blocking is in fact more acute for the Coalition. At the 2022 election the left won 19 of 36 state seats, one up on what the Coalition won in 2019. To prevent a left block (even assuming either that Pocock can be worked with or he loses) the Coalition, if it wins in 2025, would need to hold the left to two seats in two states. It did so in Queensland in 2019 (and was not that far away from doing so in 2022) and since the rise of the Greens has generally had a strong enough vote to hold the left to two in Queensland under the current system if it wins the election overall. However, the only other recent cases where the left would have been held to two were SA in 2013 and 2016 with the now collapsed Xenophon empire at its peak. So if the Coalition wins the next election by a less than stellar margin, it could be facing an incredibly unpleasant Senate and might need to go to a DD as soon as it can manage it. But DDs are generally fair under this system (the Coalition would have had a quite bearable DD result in 2019 had it needed a DD then) so if it comes to that, that's nothing to be afraid of. An obstructed government is at liberty to urgently seek a more fine-grained Senate result provided it is willing to submit itself to the judgement of the voters at the same time.
Overall I think results under the current Senate system continue to very slightly favour the left, and will probably continue to do so until more of the right minor parties get their act together and form a merged flank movement to rival the Greens. At this election especially, many of the right parties campaigned on more or less identical anti-mandates platforms, and One Nation and UAP have been fishing in much the same pond for a few elections now.
What could this election have looked like under Group Ticket Voting?
The horror, the horror ... the Coalition would have been assured of twelve state seats, Labor of ten, the Greens of three (unlike 2019 when they would not have been guaranteed any) but that leaves eleven seats still unaccounted for that might have gone anywhere depending on who did what deals. If Labor and the Greens swapped preferences that would have probably guaranteed another four between them (probably one Labor, two Greens and one to either) but they may not have actually done that. Several seats would be won by right minors or random micros, and the high vote shares of One Nation and UAP could have resulted in them each winning many seats or none. It is impossible to say which micros would have won other than that those with principles when it came to preferencing would be disadvantaged. In the ACT, because Group Ticket Voting results in near-100% preference flows, there would not be such a clear strategic argument for voting for David Pocock, and it would also be more difficult for Pocock to run a teal-style independent campaign since he would have to distribute group preferences (though perhaps he could submit multiple tickets that would keep everyone happy).
(As an aside about Group Ticket Voting I am already getting people asking me which micros I think will win in Victoria. Please note that my standard answer to this question will be along the lines of "No I do not have next week's Powerball numbers.")
Winning Vote Shares, Babet and Pocock
Of the 36 state seats, 23 (up one) were won on raw quotas, again in one case (Tasmania) complicated by some of the votes being held down the ticket, delaying the second candidate crossing the line. There were ten state tickets that had between .5 of a quota and a whole quota (either as primary vote or remainder after surpluses), all of these winning. The overlap zone ran from .2807 Q to .4658 Q and within this zone there were three wins (Labor in WA .4187, Liberal in SA .3749, UAP in Victoria .2807) and four losses (LNP Queensland .4658, Legalise Cannabis Queensland .3760, UAP Queensland .2934, One Nation NSW .2889). Additionally, One Nation in SA had a losing vote that was lower than UAP's in Victoria by 0.0000066 quotas. All of the wins in the overlap zone were off lower quota shares than any of the 2019 wins, but this had to happen because there were only 33 contenders with either a full quota or more than half a quota, compared with 37 in 2019. In all states, the primary vote winners ended up winning, though not without having their leads eaten into in some cases.
Ralph Babet's victory in Victoria off a vote share otherwise barely sufficient for getting his deposit back was a case where everyone had such a low share of a quota that somebody had to win. However, had preferencing behaviour from 2019 persisted Babet would have lost, as the 2019-model UAP was a crawler on preferences in comparison to the Coalition, Labor, Greens and One Nation. What changed here was the preference flow between the minor right parties.
There was a national trend at this election that flows between One Nation and the UAP, in both directions, were much stronger than in 2019. In most states the Liberal Democrats did not join in this party, but in Victoria they did. The 3CP preference split in Victoria between Coalition, Labor and UAP off above-the-line Liberal Democrat preferences shifted from 41.67/15.52/16.08 to 30.76/13.76/43.82. The split on One Nation preferences in Victoria shifted from 25.44/17.90/29.56 to 16.61/12.12/55.70.
The Liberal Democrat vote in Victoria, at 2.42%, was also remarkably high. In the Liberal Democrats' narrowly failed High Court challenge to party names rules, much was made of the history of the party performing more strongly when it draws to the left of the Liberal ticket than to the right - such that every vote share the party had polled when drawing to the left was higher than every vote share polled when drawing to the right, with the minor exception of the 2014 WA re-run. At this election, probably assisted by having high-profile candidates in Queensland and Victoria, the LDP had a slightly higher average (2.34 vs 2.01) in the states where it drew on the right, its average when drawing on the right being more than twice its previous average when doing so.
Including as a result of the high LDP vote, Victoria had a combined swing to One Nation, UAP and LDP of over 3%, whereas the average for other states was just over zero, with none above 1.3%. To a small degree this is attributable to the disappearance of the deregistered Democratic Labour Party and to reduced support for Hinch Justice. But this still leaves Victoria as the best state for these parties combined, although the swing against the Coalition in Victoria was not unusual.
In my view the combination of a strong LDP vote in Victoria and strengthened preference flows between all of LDP, ON and UAP is consistent with the idea that Victorian minority frustrations over lockdowns, pandemic management and vaccines helped power the UAP (or if it was not them, it would have been One Nation) to victory. Indeed the strong LDP vote and the strong preference flow from LDP to UAP meant the UAP did not even need the shift in One Nation preferences in Victoria to win; it would have won anyway.
David Pocock (ACT) was the only winner to have come from behind on preferences to win. With the ACT's low exhaust rate and with Labor helpfully polling almost exactly one quota this took on the character of a single-seat contest in which preference flows from the Greens (80.7-12.1 to Pocock over Seselja) and Kim Rubenstein's ticket (85.8-11.0 !) were every bit as fatal to Zed Seselja's chances as was generally expected; Pocock was simply much too close to Seselja on primaries. It turns out that only Pocock could have won it; if his ticket is excluded from the count, Seselja defeats the Greens. Pocock voters overwhelmingly preferenced Labor or the Greens, suggesting that that is where he drew most of his support from, but he also took enough votes from the Liberals that neither of the other parties would have taken to knock Seselja way below quota and ensure his defeat.
Preferencing Impact
While ACT was the only case of a winner coming from behind on preferences, there was potential for it to happen elsewhere and a number of reasonably close results. Four states saw some sort of three-way race (not necessarily competitive) between Labor, the Coalition and either One Nation or the UAP. In Queensland this was for the final two seats and in SA, WA and Victoria it was for a single seat. In all these cases the right-wing minor party outperformed both majors and Labor outperformed the Coalition:
Victoria UAP .3601 quotas gained/ Coalition .2445 / Labor .3496
SA One Nation .3257 / Liberal .2932 / Labor .2981
WA One Nation .3663 / Liberal .2385 / Labor .293
Queensland One Nation .4779 / LNP .2458 / Labor .2539
These flows saw Labor overtake and eliminate the Coalition in Victoria and One Nation overtake Labor and finish fifth in Queensland. (The Coalition would have lost anyway in Victoria even had they got over Labor, by about 1.2%).
In NSW Labor was eliminated before UAP and Legalise Cannabis, and here again One Nation did better on preferences than the Coalition, gaining a total of .4051 quotas through the count to the Coalition's .2904, but it was not enough as the Coalition's lead was too big.
Notably in WA Liberal preferences were no use to One Nation in their attempt to beat Labor (in fact One Nation actually went backwards on the Liberal transfer). But this was not because Liberal voters favoured Labor over One Nation (Liberal ATL voters favoured One Nation albeit insufficiently, 34.4-28.4). It was because slightly more than half of the Liberal transfer was votes received by the Liberals from other parties during the exclusion, and those votes favoured Labor.
In Tasmania, Jacqui Lambie Network increased its margin over One Nation through the count. Tasmanians were very determined to elect a fourth party - had JLN not run, One Nation would have claimed the seat instead (unlike in 2019) and had neither run, Legalise Cannabis would have beaten Eric Abetz for the final spot!
Just-Vote-1
If a voter numbers just one box above the line their vote, while contrary to the instructions, is saved by the savings provisions and counts for the party they have chosen only. Here are the percentages of just-1 votes at this election (percentages are the share of just-1s out of all votes, whether ATL or BTL):
Just-1s fell in every state except South Australia, which had recently had a state election with optional preferential voting in its upper house. The change is starkest in NSW, which had such an election just before the 2019 election. In five races (ACT, NT, NSW, Vic, Qld) the rate was the lowest to one decimal place so far under the new system. In the ACT, however, the Liberal rate did not fall at all, because the Liberals issued a just-1 how to vote card (which nearly all their voters ignored.)
It is very clear that just voting 1 isn't much of a thing, and that despite early speculation that it would grow as a protest movement, it hasn't caught on because it is a stupid form of protest.
The gong for the lowest percentage of just-1s was this time won by Canberra (0.71%) ahead of Ryan (0.76%) and usual suspects Franklin (0.82%) and Clark (0.84%). However Ryan has a far higher ATL rate than the ACT and Tasmania divisions so again easily has the lowest percentage of all ATLs as just-1s.
Exhaust
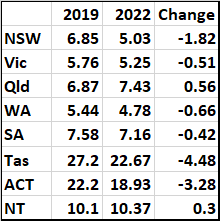
The more dispersed voting at this election seems to have lead to an increased exhaust rate, but the increase is not enormous (nationally, effective exhaust rose from 4.8% to 5.7% after being 5.1% in the 2016 double dissolution). Exhaust increased sharply in South Australia (up from 2.3% to 6.6%) and Western Australia (up from 2.0% to 5.7%) and also increased in ACT (0.1% to 1.8%), NT (0 to 0.5%), Queensland (3.9 to 4.4), Tasmania (1.9 to 3.4) and NSW (5.6 to 6.3). It fell, from a high base, in Victoria (7.0% to 6.9%).
Informal Votes
Surprisingly, informal voting fell in the House of Reps at this election, even with an increased number of candidates and especially a big rise in divisions with 8 or more candidates (which has tended to cause increased informality through confusion with the Senate system in the past). Informals also fell in the Senate, down 0.39% to just 3.42%, with the informal rate falling in every state and territory. I suspect that between these two results, the rate of deliberate informal voting at this election may have been lower than normal.
Below the lines
At this election the below the line rate fell in six races, and in five of these (NSW, Vic, WA, SA, Tas) it fell to its lowest level under the new system. The NSW reduction was because there were no significant BTL-based candidates in NSW in 2022, unlike 2019 when Jim Molan was a significant BTL candidate. The only really significant BTL campaign anywhere was for Eric Abetz in Tasmania, but the 2019 baseline for Tasmania included a more successful BTL campaign for Lisa Singh, as well as a few minor cases. Many minor candidate factors contributed to the slight rise in Queensland (which recorded its highest rate under the new system, as did NT).
Of Abetz's 4.27%, a relatively high 86.4% stayed within the ticket (slightly more going to #2 Wendy Askew than #1 Jonno Duniam) and the rest sprayed all over the place.
How To Vote Cards
In general, Senate how to vote cards are little followed, the main exception being the major parties. However even for the major parties they seem considerably less followed than for Reps how-to-vote cards, which probably have follow rates about 40%.
Measuring how well how to vote cards are followed is often difficult because of local variants and undocumented changes. I am documenting some of the variants here, the ABC has documented others that I will add. For well-known parties the variants are often obvious, but for lesser-known parties they can be hard to spot. Especially at this election I suspected there were undocumented variants for the spuriously so-called "Informed Medical Options Party".
Here is my best effort at estimating the rates at which cards were reproduced exactly (1-6 in order issued unless noted otherwise) for each party in each state:
The numbers are the proportion of above the line votes for the party that copied the card (or one of the cards where there were variants). This in general slightly overestimates how many of the party's voters as a whole copied the card, but the overestimates become larger in the states with high BTL rates (Tasmania and ACT) and for certain parties (especially the Greens).
The low rate for the Liberals in the ACT is because they issued a just-vote-1 card which was good for formality under the savings provisions but inconsistent with the instructions. Otherwise the Coalition ranged from the mid-20s to low 30s, Labor from the mid-teens to mid-20s, Greens from the high single figures to mid-teens, and most other parties were negligible. However the UAP had similar follow rates to the Greens and both the UAP and LDP had higher than normal follow rates in Victoria.
Obscure micro-parties had negligible follow rates, though I think the ABC's diligent archiving of how to vote cards may have discouraged repeats of the wonderful past cases where some cards had no perfect follows at all. I salute in particular the Citizens Party NT card copied by precisely four voters (all in Solomon) and the WA Cameron Tinley (unregistered No Mandatory Vaccination) 1-17 above the line HTV which was copied all the way by 13 hardy souls. 12 of them stopped at that point while one voter completed the full set by numbering the remaining parties (Citizens Party, Socialist Alliance, Liberal, Labor, Greens in that order).
Blank Box Of Death
Something very noticeable in 2019 was that candidates who ran with blank above the line boxes (grouped candidates not endorsed by registered parties) not only did poorly on primary votes but did appallingly on preference flows, to an extent that defied mere political logic - suggesting that voters are confused by blank ATL boxes and reluctant to place preferences in them. Examples in 2019 were Anthony Pesec (ACT), Craig Garland (Tas) and Hetty Johnston (Queensland). I recommended to JSCEM that something be done about this issue (how hard is it to just put the two candidates' surnames above the line, for instance?) but there wasn't any interest.
I don't have much sympathy with this election's victim of the curse of the blank box, former Senator Nick Xenophon, who ran at the last minute and could very easily have registered a front party had he acted sooner, or perhaps reclaimed the Centre Alliance brand. But again, the evidence is remarkable. Only 7.9% of all above the line voters included Xenophon's group in their top 6, a score exceeding only that of DPDA, Citizens Party and an obscure blank-box group. Only 8.6% numbered the blank box at all. (Bob Day's blank box did nearly twice as well as this, but it was included on a large number of how-to-vote cards). Below the line it was a whole 'nother world: Xenophon was the fourth most commonly included (just over 30%) in BTL voters' top six candidates, and over half the BTL voters numbered him somewhere. Running a blank box was either a big mistake by Xenophon or a sign that he wasn't serious about winning anyway - given the low score and indifferent preference performance the Liberals got over the line with here there is every chance that had he run with a registered party he would have been a Senator again.
Last!
I add a section for my favourite aspect of Senate electoral performance: failure in all its forms.
Australia's lowest-scoring Senate candidate was Drew Pavlou Democratic Alliance WA #2 Amina Yarmuhammad (12 votes) but that was nowhere near the lowest vote in percentage-of-a-state terms. That wooden spoon went narrowly to Jason Wardle (#2 candidate for Group Y, Vic) whose 0.00065% (25 votes) was nonetheless the highest such low score since the first election with above the line boxes in 1984.
The lowest scoring groups were generally obscure non-party groups with Group Y in Vic (Peter Byrne/Jason Wardle) again the worst of the lot on a mere 0.03% (and yes that's with an above the line box, albeit a blank one). The lowest scoring named parties with a box were the Socialist Alliance in NSW, Australian Progressives in Victoria and ACT, TNL in Queensland, Federal ICAC Now in WA, DPDA in South Australia, Federation Party in Tasmania and Citizens Party in the NT.
Generally the performances of newly registered parties, outside the ACT front parties for David Pocock and Kim Rubenstein, were poor. Only the Indigenous-Aboriginal Party in Queensland and the Local Party in Tasmania broke 1%, and the latter's performance was generally still viewed as quite ordinary as the party had been somewhat hyped and was supported by unions, Climate 200 and (for some of its candidates at least) Andrew Wilkie and Sue Hickey. Most of the other new parties did not break 0.5% and especially the much-vaunted (by themselves) TNL bombed out with 0.14% in Queensland and 0.19% in New South Wales. But plenty of established parties wasted their deposits too, with none of the following scoring 1% in any state race: Democrats, Federation, Progressives, Citizens, Fusion, IMOP, Reason, Seniors United, Socialist Alliance, Sustainable Australia, Nationals (SA), Victorian Socialists.
The phenomenon of who voters below-the-line put last on their ballots (among the tiny minority who bother voting all the way) is also a source of much fun after Eric Abetz's prodigious efforts in 2016 when he scored around eight or nine times more last places than anyone else on the ballot. In 2019 this category was a clean sweep for the deservedly reviled Fraser Anning's Conservative Nationalists, but this year we saw quite a range of last place getting talent. The most commonly last-placed candidates by voters numbering every box validly below the line were:
Vic: Stuart Huxham (ON 2)
Qld: Rebecca Haley (Green 6)
WA: Rob Forster (UAP 2)
SA: Alan Watchman (ON 2)
Tas: Eric Abetz (Lib 3)
ACT: Zed Seselja (Lib 1)
NT: Raj Rajwin (Ungrouped UAP)
Most of these candidates happened to be the last-named candidate on a ticket that was the race's least popular ticket, and Rajwin may have just been a victim of voters donkeying remaining squares. The NSW and WA last place races were very close with the bottom Coalition and Greens candidates just missing out; the bottom Coalition candidate in Victoria wasn't far off the pace either. However the efforts of Abetz and Seselja stand out here. Niche Tasmanian voters gave Abetz a BTL sendoff with 6022 valid last places (39.6% of all valid lasts, 5.15 times his nearest rival) while Seselja was not far behind with 4995 valid lasts (35.3%, 2.76 times the next closest). This tally does not include a small number of voters who left the last box for these candidates blank.
So ends a fascinating Senate contest (and, for now, the careers of a number of Senators with I think eight of them given the flick by voters and another one running for the House of Reps and losing). I may add other sections to this review but I think that's more than enough for now.
Huge thanks to David Barry for his Senate Preference Explorer (https://pappubahry.com/pseph/senate_pref/) and Andrew Conway for his ConcreteSTV Server, which allows simulations of outcomes with candidates removed or rules changed (https://vote.andrewconway.org/). Responsibility for any errors in using these fine tools is mine.
Serious respect for writing this-- an amazing trove of information.
ReplyDeleteThe proportionality issue is surprising. I suspect that it's explained largely by Tasmania (which is massively overrepresented) and New South Wales (massively underrepresented) both being reasonably close to the national median election result. That's essentially dumb luck, though, and demonstrative of how deeply problematic the Senate is as a body. If Australia's states were like American states-- with parties winning 75-25 in some extreme states-- it would fail.
There's a serious danger that a major shift in a small state's electorate (Tasmania is certainly the most likely, but SA or WA are also possible) could lead to a democratic-lockout situation where one party is wholly unable to pass legislation, including reforms to the Senate, because the Senate won't allow it.
I have to be honest and say that I just don't see any basis for such a system to exist. At best, it's a drag on the ability of the HoR to pass legislation; at worst, it's a loaded gun pointed at democratic legitimacy, threatening a US-like banana republic system where a party can consistently control the government despite being rejected by popular majorities.
I know Kevin has defended the Senate in the past, but I'm curious as to what the response to this danger is.
I don't defend Senate malapportionment - I agree with your comments there; I think Senate malapportionment is undemocratic and that we are just very lucky that small states have never harnessed it to the degree that they could. Two Senators out of 76 for Lambie Network which gets 0.2% of the national vote is a serious distortion caused by state-based malapportionment. I think we should have a PR upper house but I would reform it to make it much closer to one vote one value.
Delete(The problem is though that Senate malapportionment cannot be fixed unless all the states that would have their representation reduced individually agree to that in a referendum. It's a stronger limit than just the usual majority of voters/majority of states rule.)
DeleteWhat about reforming the topics which the Senate can legislate on? I'm thinking specifically of the Bundesrat in Germany, which is... sort of an "upper house" if you will, but has restricted jurisdiction covering only laws that affect state powers and constitutional amendments. Would that also require statewise approval?
DeleteAustralia`s states are considerably more balanced than those in the USA, presumably partly by design (differences in British colonial policy) partly by a lack of design (no state adding deliberately to unbalance the Senate), partly as a result of not having a serious division over slavery and partly by accident (capital dominated states for internal policy and wider economic reasons).
DeleteAustralian states` political balances are unlikely to shift off the national average by more than 1 Senator per half-Senate election, so a shift in a single state is unlikely to create a major blockage, particularly with double dissolutions available.
Superb work trawling through the gizzards of the results.
ReplyDeleteIf we go to 4-year terms for the Reps a case might be made for 4-year Senate terms rather than doubling to 8 years - and have all the senate up for election each time.
The original idea of the senate as a States' house is long gone - it's presently a Party's house where the occasional micro or indi gets a look in.
Brilliant. Kevin Bonham you are a national treasure.
ReplyDeleteAnd isn't it wonderful that scanning of senate ballots enables such a rich trove of analysis?